GSFIT GUI Organization and Functionality: Difference between revisions
| Line 80: | Line 80: | ||
==GSFIT Middle Panel== | ==GSFIT Middle Panel== | ||
<gallery widths= | <gallery widths=400px heights=480px perrow=2> | ||
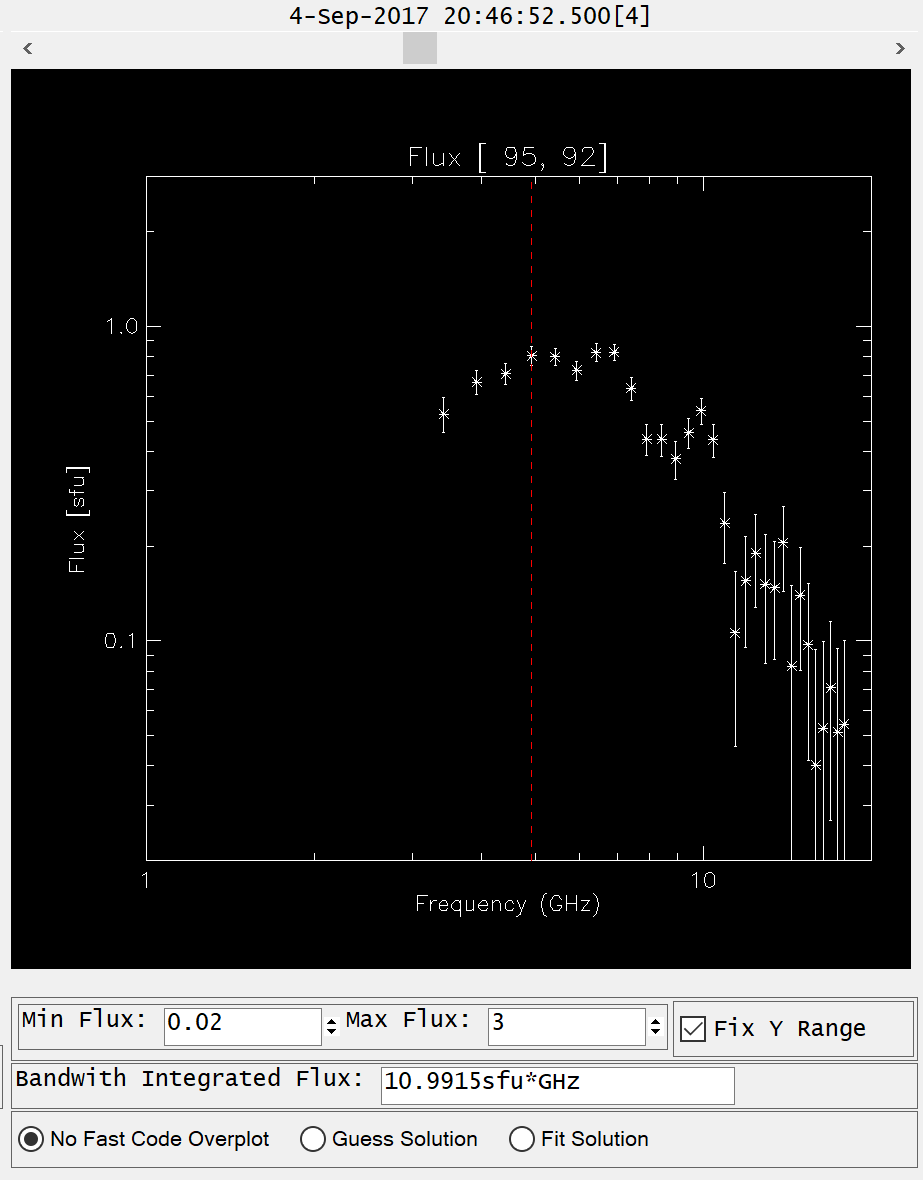
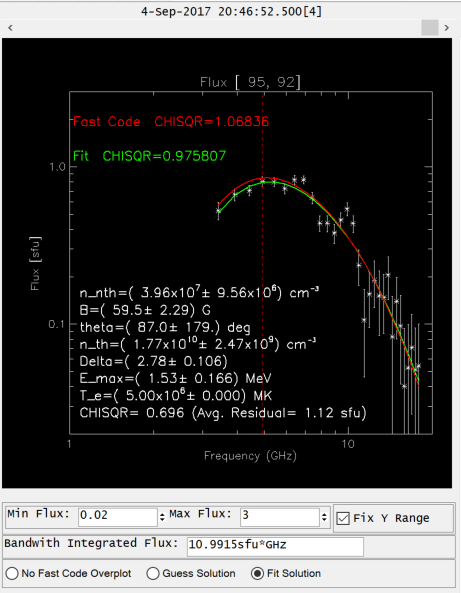
Image:MiddlePanelNoOverlay.png|a: Spectrum corresponding to the selected time frame and selected pixel on the left panel | Image:MiddlePanelNoOverlay.png|a: Spectrum corresponding to the selected time frame and selected pixel on the left panel | ||
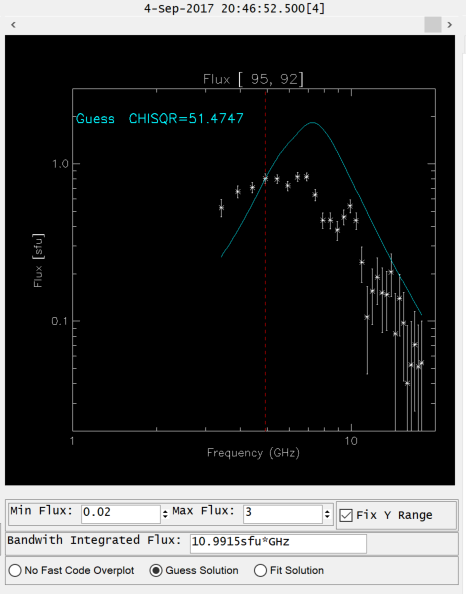
Image:MiddlePanel.png|b: Spectral plot with overlaid Fast Code guess parameters solution (cyan) | Image:MiddlePanel.png|b: Spectral plot with overlaid Fast Code guess parameters solution (cyan) | ||
Revision as of 14:24, 8 May 2019
GSFIT GUI Help
The GSFIT GUI is organized in three main sections:
- GSFIT Top Main Menu Toolbar, which may be used to perform most of the actions.
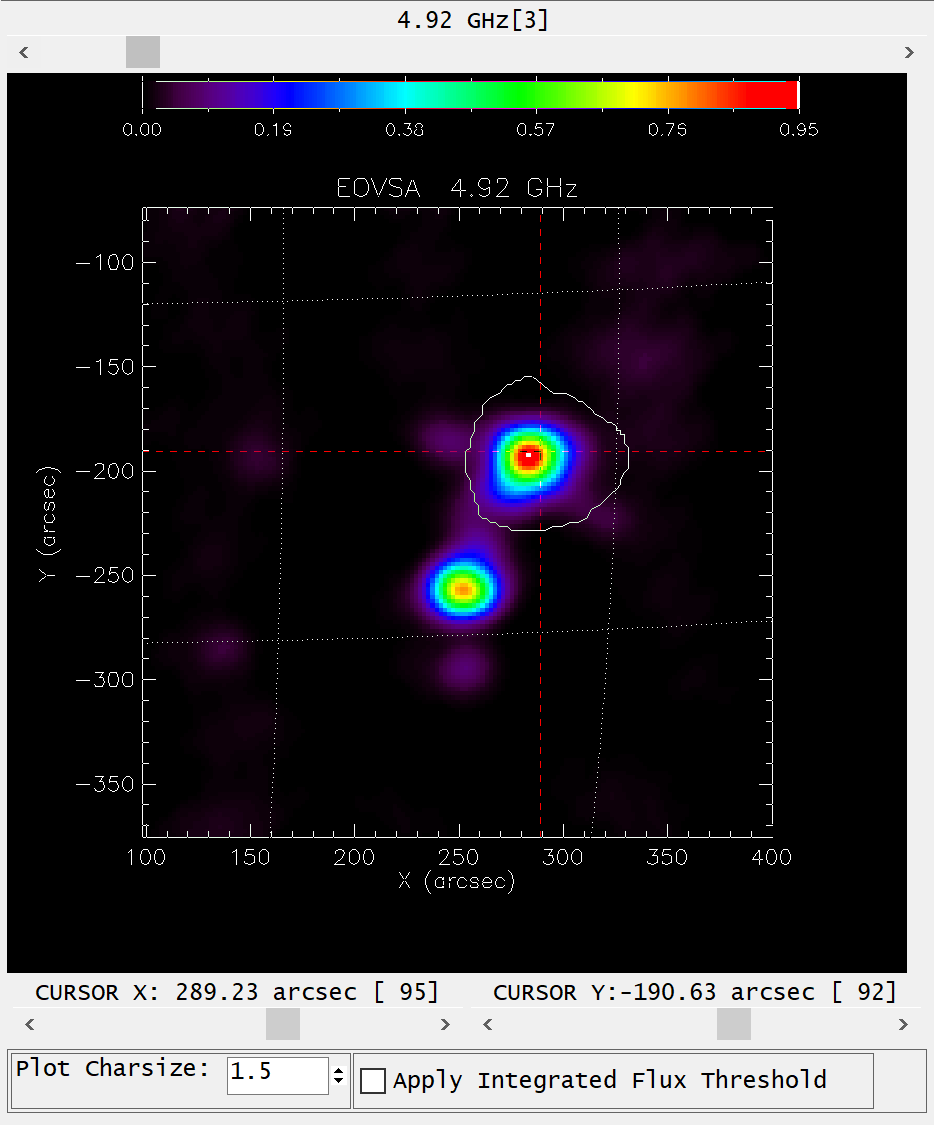
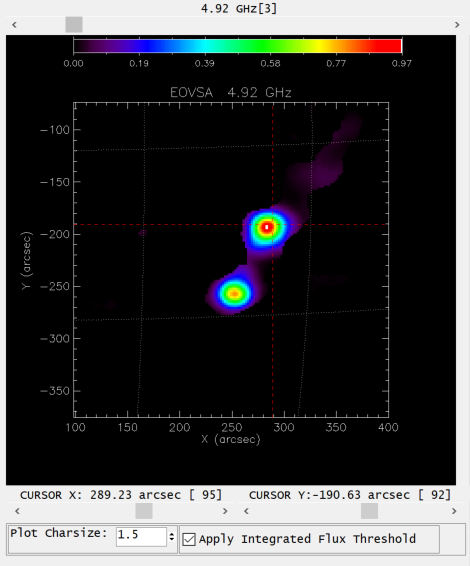
- GSFIT Left Panel, which displays a microwave map corresponding to the observing frequency and time instance selected via two horizontal scroll bars.
- GSFIT Middle Panel, which displays the microwave spectrum corresponding to the selected pixel in the right panel map.
- GSFIT Right Panel, which consists of three main elements:
- GSFIT List Scrollbar0, which allows the user to locate spatially and temporarily the fit already performed and inspect the fit results
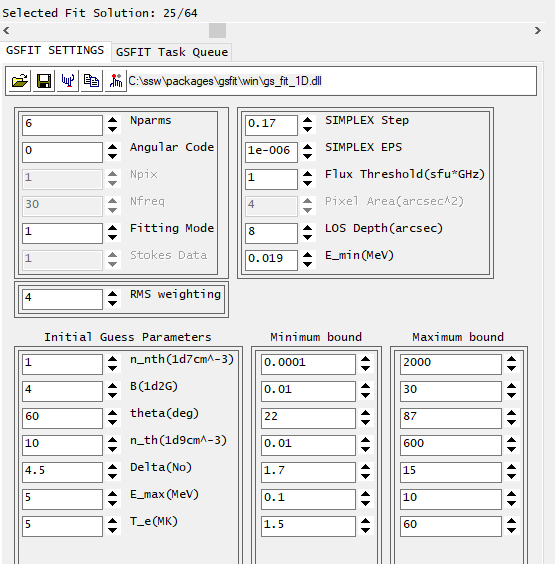
- GSFIT Settings page, which allows the user to setup a series of the spectral fit options and perform some actions via a local Toolbar menu.
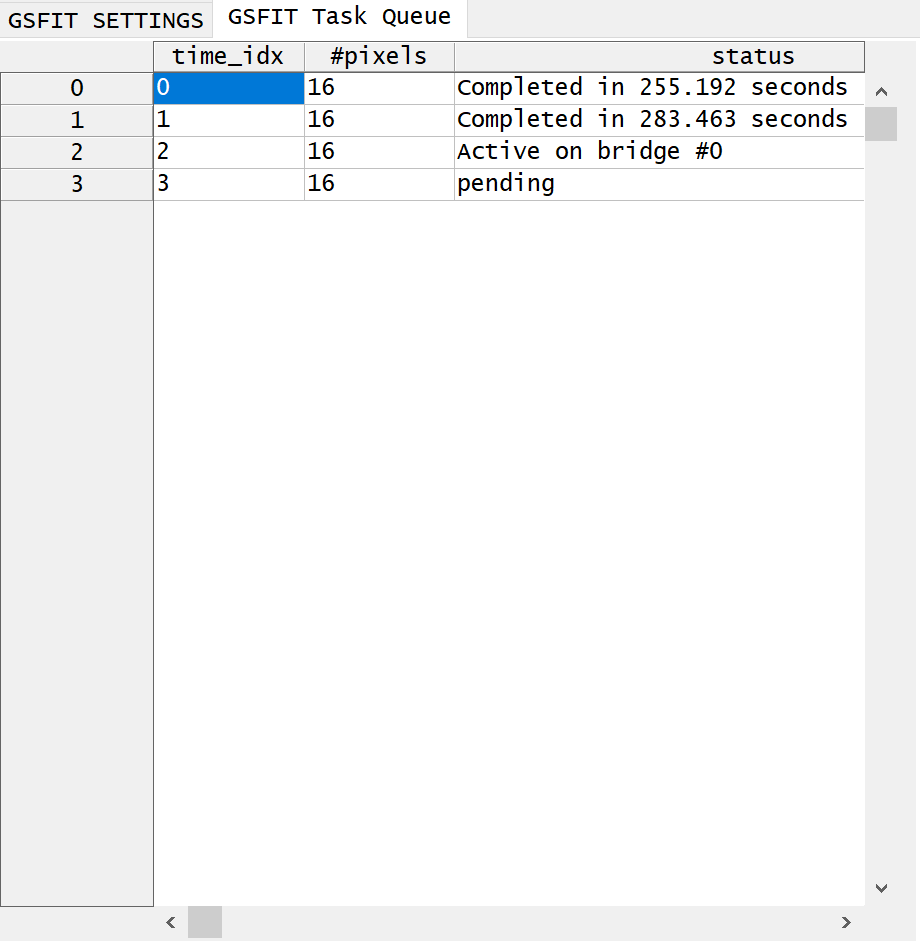
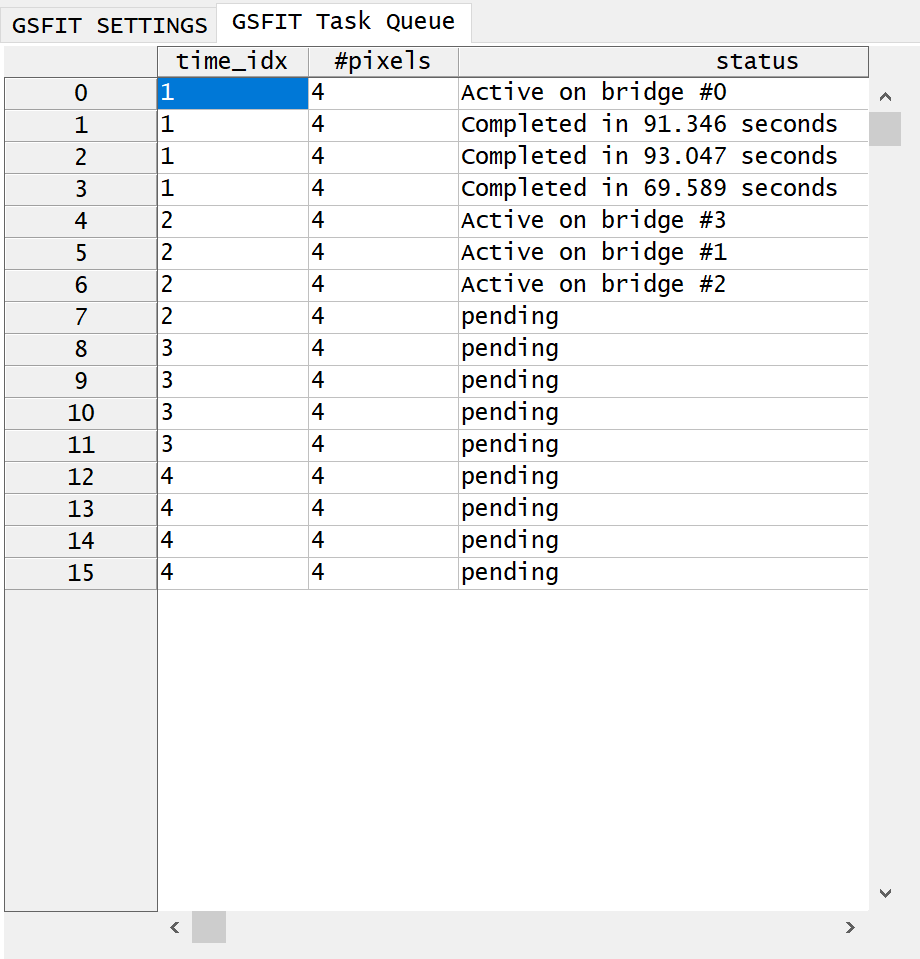
- GSFIT Task Queue page, which displays a list of completed, active, and pending fitting tasks.
GSFIT Top Main Menu Toolbar
This toolbar contain a series of action buttons described below.
 Upload EOVSA Map Cube
EOVSA map cubes are IDL sav files containg a [ntimes x nfrequencies] brightness temperature (Tb) map structure. Follow this link to learn how such EOVSA map cubes are produced. When uploaded, GSFIT converts these Tb maps to Solar Flux (total intensity or circular polarization) maps.
 Select Color Table
Use this button to select a color table for displaying the microwave maps and spectra. GSFIT uses as default the IDL color table #39 (Rainbow+White)
 Select Mouse Mode
Use this set of mutual exclusive radio buttons to switch between four modes of mouse tool operation.
- FOV/Pixel Selection Mode: Use this mouse mode to zoom in and out the field of view (FOV) of the microwave maps displayed on the GSFIT Left Panel, or to select the pixel for which the microwave spectrum is displayed in theGSFIT Middle Panel.
- To zoom in, press, hold, move, and release the left mouse button to select the desired rectangular FOV (rubber-band selection process). To revert to the full FOV, use a single left-button click.
- Use the right button to select a map pixel on the GSFIT Left Panel. The currently selected pixel is indicated by a set og horizontal and vertical dotted lines. Alternatively, the pixel may be selected using the Cursor X and Cursor Y numerical controls located below the map plot area.
- Rectangular ROI Selection Mode: Use this mouse mode to define a rectangular region of interest (ROI) through a left button rubber-band selection process. The selected ROI is preserved and displayed as long it is not replaced by another ROI selection, or deleted by a single left button click.
- Polygonal ROI Selection Mode: Use this mouse mode to define the vertices of polygonal ROI through a series of sequential left button clicks. To finalize the process, use a right button click to define the last vertex, which will be automatically connected with the first one. The selected ROI is preserved and displayed as long it is not replaced by another ROI selection, or deleted by a single left button click.
- Free-hand ROI Selection Mode: Use this mouse mode to define an arbitrarily shaped ROI contour through a continues movement of the mouse cursor while the left button is pressed. To finalize the process, release the left button to define the last vertex of the countour, which will be automatically connected with the first one. The selected ROI is preserved and displayed as long it is not replaced by another ROI selection, or deleted by a single left button click.
 Save ROI
Use this button to save to an IDL file the current ROI selection as a set of two arrays, xroi and yroi, containing its vertex heliocentric coordinates.
 Restore ROI
Use this button to import from an IDL file a set of xroi and yroi ROI vertex coordinates previously saved by GSFIT, or generated by alternative means.
 Select Fit Frequency Range
Use this set off drop lists controls to select the frequency range to be used for spectral fitting. By default, the full frequency range is selected when a map data cube is uploaded, but the user may choose to restrict this default frequency range for various reasons, such as data quality, or apparent source nonuniformity.
 Fit Selected Pixel
Use this button to fit the microwave spectrum displayed on the GSFIT Middle Panel using the selected fit frequency range and the settings displayed on the GSFIT Settings panel.
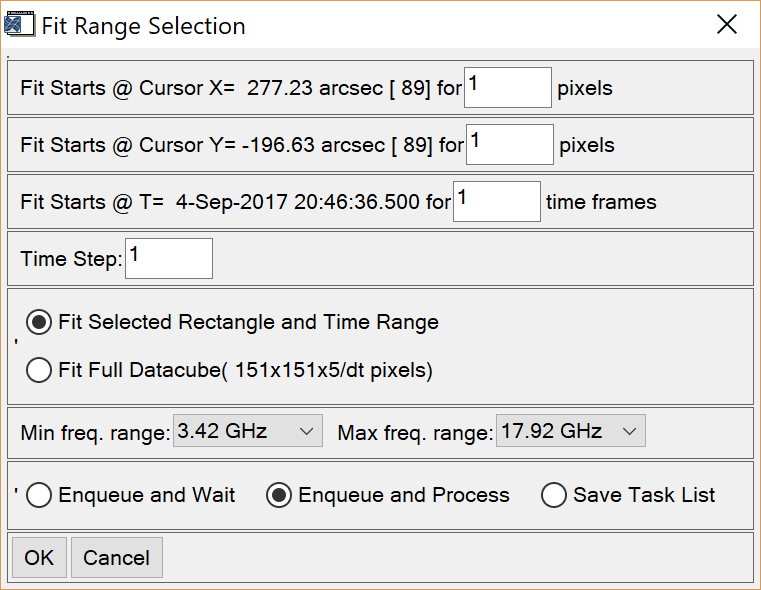
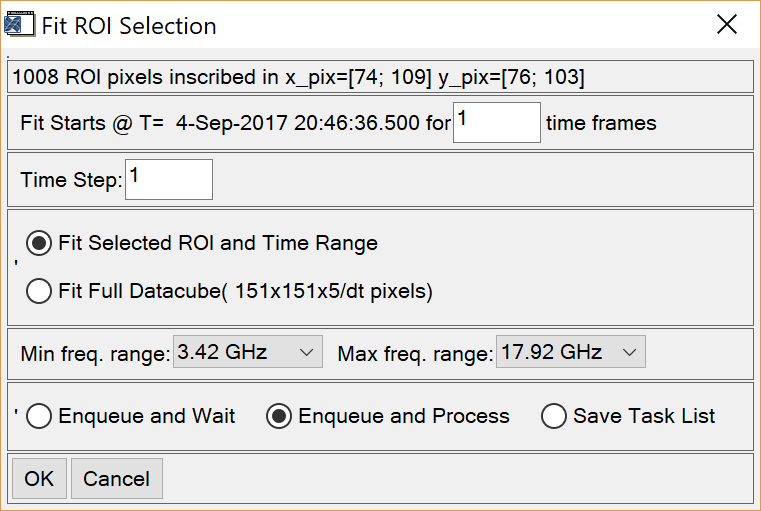
 Fit Range
Use this button to perform one or more of the following actions:
- Define a rectangular ROI starting at the current cursor position, if no ROI has been previously defined
- Select a time range and time resolution for producing a sequence of fits for each ROI pixel
- Ignore the current ROI and Time Range selections and choose instead to fit the entire map cube
- Use or change the current FIT Frequency Range selection
- Enqueue and start processing the fitting of all ROI pixels over the user-defined time interval (default)
- Enqueue and Wait for future processing of the fit task of all ROI pixels over the user-defined time interval
- Generate and save the fit task for future batch processing by the GSFIT Command Prompt (GSFITCP) application.
Depending on whether or not a ROI is already defined, the user is exposed to a different dialog box to define a fitting task.
To enqueue the fit tasks for immediate or future processing by GSFIT, the following rules are followed:
- All ROI spectra from a given time frame are processed simultaneously by being as evenly as possible assigned to all active asynchronous parallel threads
- The individual time frames are enqueued and processed sequentially
An example about how the tasks are scheduled is provided in the GSFIT Task Queue section.
NOTE: If a fit task is saved for future batch processing, the scheduling is performed at runtime by the GSFIT Command Prompt (GSFITCP) application using the number of active parallel threads available to it.
 Process Pending Tasks
Use this button to start processing all pending tasks in the GSFIT Queue
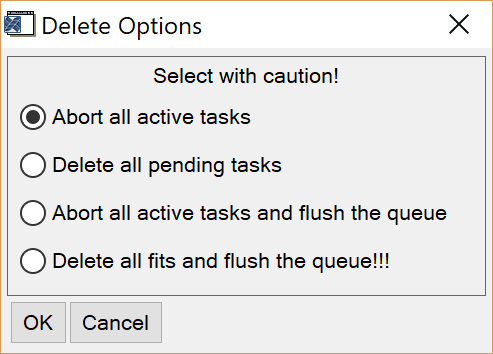
 Abort/Delete Tasks
Use this button to select one of the options from the Delete Options dialog box.
GSFIT Left Panel
GSFIT Middle Panel
GSFIT Right Panel
The GSFIT Right Panel consists of three main elements described below.
GSFIT List Scrollbar
This scrollbar may be used to navigate through the list of already computed fit solutions, if any. The scrollbar displays the selected solution index and the total number of computed solutions. These fit solutions are indexed in the order in which they are processed by the Task Queue, thus they may not be necessarily clustered in space or time.
Upon selection of a particular fit index the following actions are automatically performed:
- The time frame corresponding to the fit is selected and displayed on the Time Scrollbar
- The corresponding data map at the frequency currently selected by the Frequency Scrollbar is displayed in the Left Panel
- The Right Panel cursor is moved to the corresponding pixel position, which is also displayed by the Cursor X and Cursor Y controls located below the Right Panel plot area
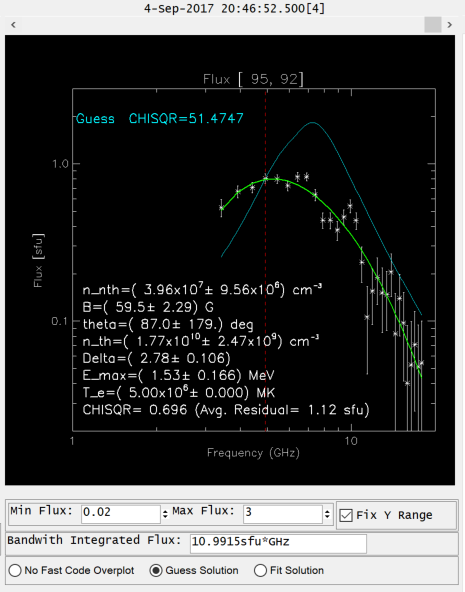
- The microwave spectrum corresponding to the selected pixel position and time frame is displayed in the Middle Panel and the fit solution is overlaid.
Upon selection of a particular pixel and time frame by use of the mouse, numerical cursors, or the time scrollbar that matches an already computed fit solution, the fit solution is overlaid on the Middle Panel spectral plot, and the GSFIT List Scrollbar is moved to the matched fit index.
GSFIT Settings
GSFIT Task Queue
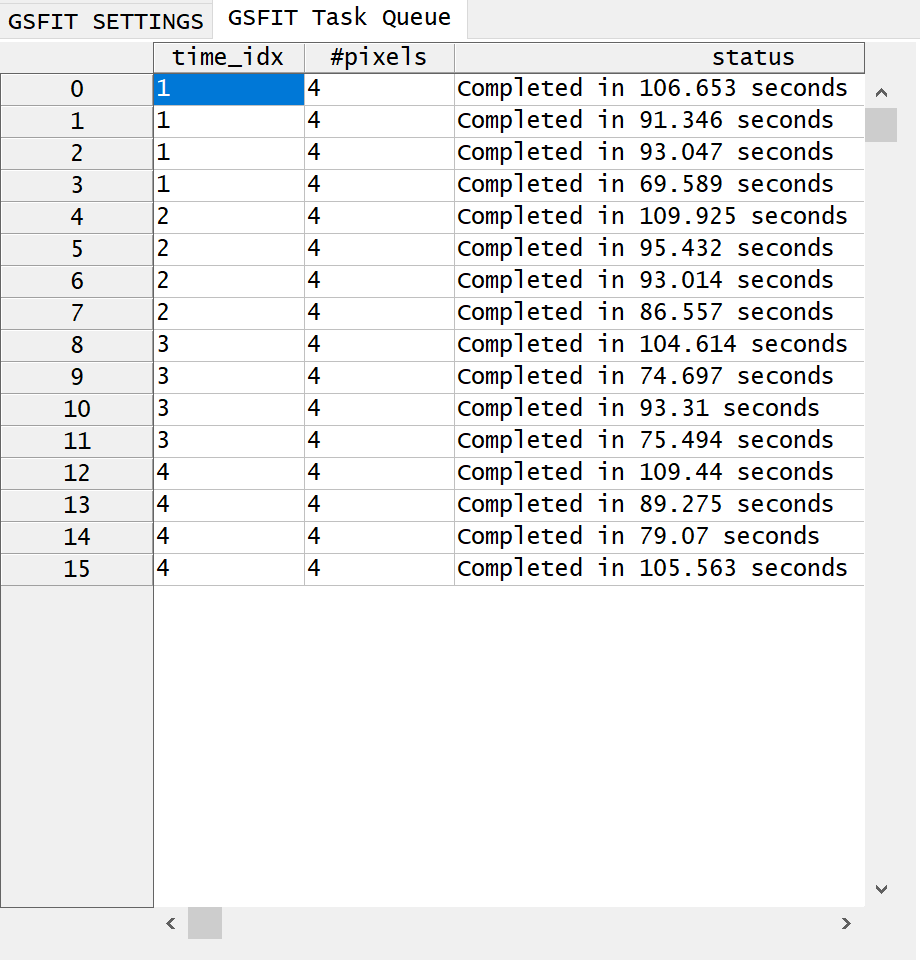
This GSFIT Right Panel page displays the current status of the already processed, active, or pending fit tasks. The GSFIT top menu toolbar provides several options for controlling the GSFIT Task Queue.
Here we provide an example of how the tasks are enqueued and processed in two diffrent circumstances:
If a 4x4 ROI; 4 time frames is enqueued while only 1 parallel thread is active, only 16 pixels from the same time frame are processed at any given time. If, instead, 4 active threads are used, batches of 4 pixels are processed by 4 asynchronous threads at any given time. Note that, in the case of 4 active threads, the time needed to fully process a given time frame is dictated by the longest time needed to process one of the 4 pixel batched of that frame, which is about half the time needed to process all 16 pixels in a single thread.
