File:Fig-qlookplot3.png: Difference between revisions
Jump to navigation
Jump to search
(EOVSA multi-frequency synthesis image of a C flare on 2017 Aug 21 at 20:21:10-20:21:18 in 12-14 GHz. The double microwave source corresponds well with the double flare ribbon in extreme ultra-violet.) |
(Bchen uploaded a new version of "File:Fig-qlookplot3.png") |
(No difference)
| |
Latest revision as of 12:48, 20 May 2019
EOVSA multi-frequency synthesis image of a C flare on 2017 Aug 21 at 20:21:10-20:21:18 in 12-14 GHz. The double microwave source corresponds well with the double flare ribbon in extreme ultra-violet.
File history
Click on a date/time to view the file as it appeared at that time.
| Date/Time | Thumbnail | Dimensions | User | Comment | |
|---|---|---|---|---|---|
| current | 12:48, 20 May 2019 | 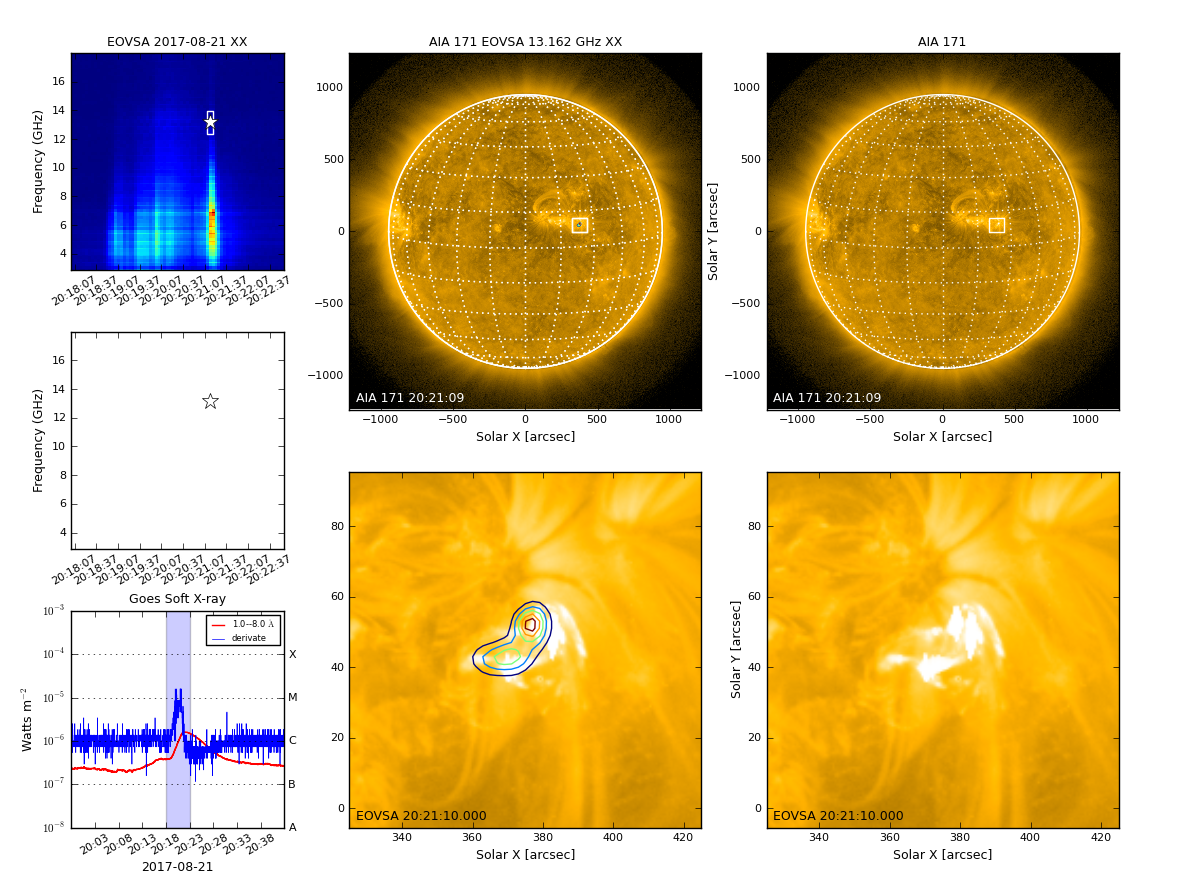 | 1,190 × 890 (463 KB) | Bchen (talk | contribs) | Fix GOES plot date. |
| 12:15, 20 May 2019 |  | 1,190 × 890 (463 KB) | Bchen (talk | contribs) | EOVSA multi-frequency synthesis image of a C flare on 2017 Aug 21 at 20:21:10-20:21:18 in 12-14 GHz. The double microwave source corresponds well with the double flare ribbon in extreme ultra-violet. |
You cannot overwrite this file.
File usage
The following page uses this file: