Information: Difference between revisions
Jump to navigation
Jump to search
No edit summary |
No edit summary |
||
| Line 1: | Line 1: | ||
Data are [http://ovsa.njit.edu/ | =Sample EOVSA Data= | ||
# IDB20170910154625.corrected.ms (171 MB) [http://ovsa.njit.edu/imaging_workshop/Flare_20170910/IDB20170910154625.corrected.ms.tar.gz] containing the first 10 minutes of the flare, calibrated but no self-calibration | Data are [http://ovsa.njit.edu/imaging_workshop/ here]. Here are some things to consider when working with the data: | ||
* Antennas 1-8 and 12 have a wide sky coverage, while antennas 9-11 and 13 are the older equatorial mounts that can only cover +/- 55 degrees from the meridian. All antennas were tracking for the flare, but for portions of the all-day scan (roughly before 1600 UT or after 2400 UT) only 9 antennas will be tracking. Data for non-tracking antennas is NOT flagged, so if you try to image these periods, you'll need to manually omit ants 9-11 and 13. | |||
* Because of the 2.5 GHz high-pass filters, data are taken only for bands 4-34. These will be labeled spectral window (spw) 0-31 in the measurement sets. However, band 4 (spw 0) is currently not calibrated, so only the 30 spectral windows 1-31 (bands 5-34, or frequencies 3-18 GHz) are valid data. You'll need to omit spw 0 when making images. | |||
* In principle, circular polarization should be valid and meaningful, but no polarization calibration has been done (yet) so no non-ideal behavior (leakage terms, etc.) have been accounted for. | |||
==Flare Data== | |||
Folder [http://ovsa.njit.edu/imaging_workshop/Flare_20170910/ Flare_20170910] contains two measurement sets at full 1-s time resolution, each with 10-min duration: | |||
# IDB20170910154625.corrected.ms (171 MB) [http://ovsa.njit.edu/imaging_workshop/Flare_20170910/IDB20170910154625.corrected.ms.tar.gz] containing the first 10 minutes of the flare (15:46:25-15:56:25 UT), calibrated but no self-calibration | |||
# IDB20170910154625.corrected.ms.xx.selfcaled (66 MB) [http://ovsa.njit.edu/imaging_workshop/Flare_20170910/IDB20170910154625.corrected.ms.xx.slfcaled.tar.gz] self-calibrated data for polarization XX | # IDB20170910154625.corrected.ms.xx.selfcaled (66 MB) [http://ovsa.njit.edu/imaging_workshop/Flare_20170910/IDB20170910154625.corrected.ms.xx.slfcaled.tar.gz] self-calibrated data for polarization XX | ||
# IDB20170910155625.corrected.ms (232 MB) [http://ovsa.njit.edu/imaging_workshop/Flare_20170910/IDB20170910155625.corrected.ms.tar.gz] containing the second 10 minutes of the flare | # IDB20170910155625.corrected.ms (232 MB) [http://ovsa.njit.edu/imaging_workshop/Flare_20170910/IDB20170910155625.corrected.ms.tar.gz] containing the second 10 minutes of the flare (15:56:25-16:06:25 UT) | ||
# IDB20170910155625.corrected.ms.xx.selfcaled (77 MB) [http://ovsa.njit.edu/imaging_workshop/Flare_20170910/IDB20170910155625.corrected.ms.xx.slfcaled.tar.gz] self-calibrated data for polarization XX | # IDB20170910155625.corrected.ms.xx.selfcaled (77 MB) [http://ovsa.njit.edu/imaging_workshop/Flare_20170910/IDB20170910155625.corrected.ms.xx.slfcaled.tar.gz] self-calibrated data for polarization XX | ||
==All Day Quiet Sun/Active Region Data== | |||
Folder | Folder [http://ovsa.njit.edu/imaging_workshop/AR_20170710/ AR_20170710] contains 8 calibrated measurements sets at 60-s time resolution. | ||
# The seven UDB20170710*.corrected.ms are files for each scan separately, ranging in size from 7 - 150 MB depending on the length of the scan. | # The seven UDB20170710*.corrected.ms are files for each scan separately, ranging in size from 7 - 150 MB depending on the length of the scan. | ||
# UDB20170710_allday.ms ( | # UDB20170710_allday.ms (268 MB) [http://ovsa.njit.edu/imaging_workshop/AR_20170710/UDB20170710_allday.ms.tar.gz] is the same data concatenated into a single file. However, each scan has a separate source ID. | ||
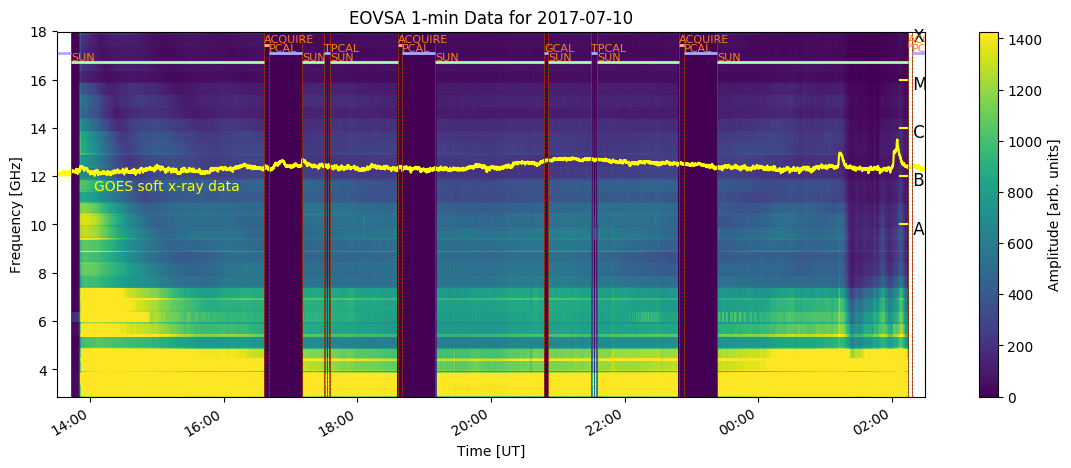
The AR data are also calibrated but not self-calibrated. In fact, we need to create a strategy for self-calibration of such data. You can get an overview of the AR coverage on that day by looking at the plot at http://ovsa.njit.edu/flaremon/daily/2017/XSP20170710.png. The separate scan files above are labeled with the time of the start of the scan, and each scan covers the time of continuous solar data between each calibration scan. | The AR data are also calibrated but not self-calibrated. In fact, we need to create a strategy for self-calibration of such data. You can get an overview of the AR coverage on that day by looking at the plot at http://ovsa.njit.edu/flaremon/daily/2017/XSP20170710.png. The separate scan files above are labeled with the time of the start of the scan, and each scan covers the time of continuous solar data between each calibration scan. | ||
Revision as of 19:23, 2 January 2018
Sample EOVSA Data
Data are here. Here are some things to consider when working with the data:
- Antennas 1-8 and 12 have a wide sky coverage, while antennas 9-11 and 13 are the older equatorial mounts that can only cover +/- 55 degrees from the meridian. All antennas were tracking for the flare, but for portions of the all-day scan (roughly before 1600 UT or after 2400 UT) only 9 antennas will be tracking. Data for non-tracking antennas is NOT flagged, so if you try to image these periods, you'll need to manually omit ants 9-11 and 13.
- Because of the 2.5 GHz high-pass filters, data are taken only for bands 4-34. These will be labeled spectral window (spw) 0-31 in the measurement sets. However, band 4 (spw 0) is currently not calibrated, so only the 30 spectral windows 1-31 (bands 5-34, or frequencies 3-18 GHz) are valid data. You'll need to omit spw 0 when making images.
- In principle, circular polarization should be valid and meaningful, but no polarization calibration has been done (yet) so no non-ideal behavior (leakage terms, etc.) have been accounted for.
Flare Data
Folder Flare_20170910 contains two measurement sets at full 1-s time resolution, each with 10-min duration:
- IDB20170910154625.corrected.ms (171 MB) [1] containing the first 10 minutes of the flare (15:46:25-15:56:25 UT), calibrated but no self-calibration
- IDB20170910154625.corrected.ms.xx.selfcaled (66 MB) [2] self-calibrated data for polarization XX
- IDB20170910155625.corrected.ms (232 MB) [3] containing the second 10 minutes of the flare (15:56:25-16:06:25 UT)
- IDB20170910155625.corrected.ms.xx.selfcaled (77 MB) [4] self-calibrated data for polarization XX
All Day Quiet Sun/Active Region Data
Folder AR_20170710 contains 8 calibrated measurements sets at 60-s time resolution.
- The seven UDB20170710*.corrected.ms are files for each scan separately, ranging in size from 7 - 150 MB depending on the length of the scan.
- UDB20170710_allday.ms (268 MB) [5] is the same data concatenated into a single file. However, each scan has a separate source ID.
The AR data are also calibrated but not self-calibrated. In fact, we need to create a strategy for self-calibration of such data. You can get an overview of the AR coverage on that day by looking at the plot at http://ovsa.njit.edu/flaremon/daily/2017/XSP20170710.png. The separate scan files above are labeled with the time of the start of the scan, and each scan covers the time of continuous solar data between each calibration scan.