Owen's Notes: Difference between revisions
No edit summary |
|||
| (634 intermediate revisions by 4 users not shown) | |||
| Line 1: | Line 1: | ||
== List of Routine Tasks == | |||
== | === Daily Tasks === | ||
Check the following pages: | |||
[http://ovsa.njit.edu/status.php http://ovsa.njit.edu/status.php] The all-day plot from the previous day is at the bottom of the page. The last 45 minutes of data is at the top right of the page or direct link is here: http://ovsa.njit.edu/flaremon/XSP_latest.png | |||
[http://www.ovsa.njit.edu/browser/ http://www.ovsa.njit.edu/browser/] This defaults to showing pipeline output from two days previous. | |||
[http://ovsa.njit.edu/pointing/ http://ovsa.njit.edu/pointing/] The latest pointing plot(s) at the bottom. | |||
[http://ovsa.njit.edu/phasecal/ http://ovsa.njit.edu/phasecal/] The latest phasecal vs. frequency is somewhere in the middle, i.e. the bottom of the list of pcf*.png files. | |||
[http://ovsa.njit.edu/EOVSA/ant_status.php http://ovsa.njit.edu/EOVSA/ant_status.php] Current antenna status. | |||
'''** Ensure that the schedule is running and updating. Check that the stateframe is updating. Check frequently! **''' | |||
Check that the data files are being updated. Goto the user@dpp terminal and type: | |||
<pre style="font-family:courier">ls /data1/IDB |tail</pre> | |||
Check that the adc_plot.py program is running. | |||
Regularly check to see if a flare is in progress (http://ovsa.njit.edu/status.php). If there is a flare in progress you may need to pause the schedule (http://www.ovsa.njit.edu/wiki/index.php/Owen%27s_Notes#Pausing_and_Adjusting_the_Schedule). | |||
Perform a Phase Calibration | |||
Check that the network monitoring function (fix_packets()) is working on the DPP. It can also be seen as dropouts on the spectrogram ([http://ovsa.njit.edu/status.php http://ovsa.njit.edu/status.php]). | |||
Check the Front End Power on the stateframe display. These values should be between about 0 and 3dBm. If the front end power looks suspicious, you can check it by plotting the front end power vs time (see here for instructions: http://www.ovsa.njit.edu/wiki/index.php/Owen%27s_Notes#Plotting_Stateframe_Data). | |||
If there are any problems with any of the antennas goto [http://ovsa.njit.edu/EOVSA/ant_status/ant_status_form.php http://ovsa.njit.edu/EOVSA/ant_status/ant_status_form.php] and fill out the appropriate form. | |||
=== Weekly Tasks === | |||
Perform a Gain Calibration | |||
Check the NJIT Vehicle: | |||
:Ensure fluid levels are good. | |||
:Check the rodent baits and replace as needed. | |||
:Check the engine compartment for signs of rodents. | |||
:Drive the vehicle for at least 1/2 hour per week. | |||
=== Monthly Tasks === | |||
Perform a Pointing Calibration | |||
== Login Procedures == | |||
=== Remote Login === | |||
The computers can be accessed remotely using SSH and VNC. Since I use Linux (Ubuntu) these instruction are for that OS. | |||
==== Helios ==== | |||
To VNC into Helios, open a terminal and type the following command: | |||
<pre style="font-family:courier">ssh -L 5902:helios.solar.pvt:20000 oweng@ovsa.njit.edu</pre> | |||
Note replace oweng with your gateway login name) | |||
Then open Remmina Remote Desktop Client. Make sure VNC is selected at the top left. Type in: | |||
<pre style="font-family:courier">localhost:2</pre> | |||
and enter the password when prompted. | |||
The Helios display should now be visible. | |||
Occasionally, the VNC connection will be lost. If this occurs the following procedure need to be performed. | |||
From a new terminal window type: | |||
<pre style="font-family:courier">ssh -L 8887:helios.solar.pvt:22 oweng@ovsa.njit.edu</pre> | |||
From another terminal issue the command: | |||
<pre style="font-family:courier">ssh -p 8887 sched@localhost</pre> | |||
Now type in: | |||
<pre style="font-family:courier">x11go</pre> | |||
Now restart the VNC client. | |||
'''Note that the VNC connection issue should now be resolved. If you notice it dropping out let Owen know what you were doing at the time.''' | |||
==== Pipeline ==== | |||
To log in to pipeline, from a terminal enter the command: | |||
<pre style="font-family:courier">ssh -L 8888:pipeline.solar.pvt:22 oweng@ovsa.njit.edu</pre> | |||
Then from a new terminal enter: | |||
<pre style="font-family:courier">ssh -p 8888 user@localhost</pre> | |||
==== Win1 ==== | |||
To log in to the win1 machine, from a terminal enter the command: | |||
<pre style="font-family:courier">ssh -L 8889:win1.solar.pvt:5900 oweng@ovsa.njit.edu</pre> | |||
Then from a new VPN client enter the hostname: | |||
<pre style="font-family:courier">localhost:8889</pre> | |||
==== DPP ==== | |||
To login to the DPP machine, from a terminal enter the command: | |||
<pre style="font-family:courier">ssh -L 8890:dpp.solar.pvt:5900 oweng@ovsa.njit.edu</pre> | |||
Then from a new terminal enter: | |||
<pre style="font-family:courier">ssh -p 8900 user@localhost</pre> | |||
=== Remote File Copy === | |||
To copy files using scp (SSH-COPY) through the above tunnels, use the command (this example for port 8888): | |||
<pre style="font-family:courier">scp -P 8888 user@localhost:<path and file to copy> <file destination></pre> | |||
=== Local Login === | |||
If logging into a computer locally on site then the following procedures are used: | |||
==== Helios ==== | |||
Open the Remmina Remote Desktop Client. Make sure VNC is selected at the top left. Type in: | |||
<pre style="font-family:courier">helios:20000</pre> | |||
and enter the password when prompted. | |||
The Helios display should now be visible. | |||
To access a helios terminal, from a new terminal window type: | |||
<pre style="font-family:courier">ssh sched@helios</pre> | |||
==== Pipeline ==== | |||
To log in to pipeline, from a terminal enter the command: | |||
<pre style="font-family:courier">ssh user@pipeline</pre> | |||
==== Win1 ==== | |||
To log in to the win1 machine, from a new VPN client enter the hostname: | |||
<pre style="font-family:courier">win1</pre> | |||
==== DPP ==== | |||
To login to the DPP machine, from a terminal enter the command: | |||
<pre style="font-family:courier">ssh user@dpp</pre> | |||
<!-- | |||
=== Setting up new accounts === | |||
==== Administrators ==== | |||
The most likely computers on which a new user will need to be added will be on the Gateway computer and pipeline. As they are both Ubuntu systems the procedure is identical for both. | |||
Login to an account with superuser priveliges on the computer where the new account is to be created. | |||
From a terminal issue the command: | |||
<pre style="font-family:courier">sudo useradd -m -d /opt/''username'' ''username''</pre> | |||
where ''username'' is the name of the new account. | |||
You will be prompted to enter a password. If creating the account for someone else, ensure they change it after their first login. They can issue the command | |||
<pre style="font-family:courier">passwd</pre> | |||
If creating the account on pipeline, they will probably need access to the python files located in :<span style="font-family:courier">/common/python/current/</span> | |||
To set this up, edit the :<span style="font-family:courier">~/.bash_profile</span> using nano: | |||
<pre style="font-family:courier">nano ~/.bash_profile</pre> | |||
Add the following line: | |||
<pre style="font-family:courier">export PYTHONPATH="/common/python/current":"/common/python/mapping"</pre> | |||
Press <CRTL> X to exit and when prompted press Y to save the file. | |||
To immediately make the changes to effect issue the command: | |||
<pre style="font-family:courier">source ~/.bash_profile</pre> | |||
If a user requires superuser privileges, from an account with superuser access enter the following: | |||
<pre style="font-family:courier">sudo usermod -aG sudo ''user''</pre> | |||
where ''user'' is the name of the account you are granting the privileges. --> | |||
== Setting up Accounts for Remote Access == | |||
=== Administrators === | |||
Log in to the gate way machine and start a superuser prompt: | |||
<pre style="font-family:courier">su</pre> | |||
or | |||
<pre style="font-family:courier">sudo su</pre> | |||
Then issue the following commands: | |||
<pre style="font-family:courier"> | |||
useradd -m -s /bin/bash ''username'' | |||
usermod -a -G ''username'' ''username'' | |||
cd /home/''username'' | |||
mkdir .ssh | |||
chown ''username'' .ssh | |||
chmod 700 .ssh | |||
</pre> | |||
Once the above commands have been entered, ask the user to send you the public ssh key. Once you have this issue the following commands: | |||
<pre style="font-family:courier"> | |||
echo "''public key''" > .ssh/authorized_keys | |||
chmod 600 .ssh/authorized keys | |||
</pre> | |||
Note that the public key will be be very long. There can be no new line in the key, and the key should start with 'ssh rsa'. | |||
The user should now be able to access the gateway machine. | |||
=== Linux Users === | |||
You must generate a pair of ssh keys to be able to access the gateway machine. From a command prompt issue the following command: | |||
<pre style="font-family:courier">ssh-keygen</pre> | |||
This will generate a pair of keys in the .ssh folder. The id_rsa file is the private key. '''DO NOT SHARE YOUR PRIVATE KEY WITH ANYBODY!''' | |||
The id_rsa.pub file is the public key. Email this key to Owen or Dale and they will had it to your account. Note that Tohbans will typically be using the guest account. You will be notified once your public key has been added to the authorized_keys file. You should then be able to login. | |||
Repeat this process if you have more than one machine that you wish to log into. | |||
== Helios Displays == | |||
=== Schedule Window === | |||
The Schedule window shows the currently running schedule as shown below. | |||
[[File:Schedule_Window.png|none|The Schedule Window]] | |||
The left side of the window shows each of the scripts that is to be run. The orange bar shows the task that is currently being run. | |||
The right side of the window shows each command that is to be run in the current script. | |||
At the bottom of the window are a series of buttons. The STOP button will stop at the current script. Once stopped, the remaining buttons will become active. To restart the schedule click on the GO button. | |||
==== Restarting the schedule window ==== | |||
If the schedule window has locked up then you will need to close it. Click on the X at the top right of the screen. | |||
If this does not work then from a helios terminal type in the command: | |||
<pre style="font-family:courier">ps -elf | grep "schedule"</pre> | |||
An output similar to that below will be displayed: | |||
[[file:Sched_pid.png]] | |||
Note down the PID for the <span style="font-family:courier">/current/python/common/schedule.py</span> program, marked in red. Note that the number will be different from the one in this example. | |||
To terminate the program type: | |||
<pre style="font-family:courier">kill -9 PID#</pre> | |||
where PID# is the number obtained from the ps command. | |||
If the schedule window gets closed (or you closed it), it will need to be restarted. | |||
Follow the procedure below. | |||
From a helios terminal issue the the command: | |||
<pre style="font-family:courier">screen -ls</pre> | |||
This will list all of the available screens as shown below. | |||
[[file:Screenlist.png]] | |||
If the schedule is listed (marked in red below) | |||
[[file:Screenlist-sched-marked.png]] | |||
then issue the command: | |||
<pre style="font-family:courier">screen -r schedule</pre> | |||
to restore the current screen. Take a screen capture of the terminal window if there are any errors listed and send a copy to Owen or Dale. | |||
If it is not listed then issue the command: | |||
<pre style="font-family:courier">screen -S schedule</pre> | |||
to start a new screen. | |||
In either case once the screen is open change to the ~/Dropbox/PythonCode/Current directory: | |||
<pre style="font-family:courier">cd ~/Dropbox/PythonCode/Current</pre> | |||
Restart the schedule: | |||
<pre style="font-family:courier">python /common/python/current/schedule.py &</pre> | |||
Press <CRTL>AD to exit from screen. | |||
For more information on the screen command see http://www.ovsa.njit.edu/wiki/index.php/Owen%27s_Notes#Screen_Command | |||
=== Stateframe Display === | |||
The Stateframe display shows the current status of the system as shown below: | |||
[[File:Sf_display.png]] | |||
There are problems with any antennas or systems that are highlighted in red. Lines that are marked in yellow designate a warning, but may not be critical. | |||
Lines marked in purple are collapsible sections. Clicking on them will expand or collapse the section. | |||
The tabs near the top of the display bring up different sections and enable graphs to be plotted. | |||
Note that the Log Stateframe box should be marked in blue. If there is a second Stateframe display running this box will be unmarked on the second display. | |||
==== Restarting the Stateframe Display ==== | |||
If the stateframe window gets closed it will need to be restarted. Follow the procedure below. | |||
From a helios terminal issue the the command: | |||
<pre style="font-family:courier">screen -ls</pre> | |||
This will list all of the available screens as shown below. | |||
[[file:Screenlist.png]] | |||
If the stateframe is listed (marked in red below) | |||
[[file:Screenlist-sf-marked.png]] | |||
then issue the command: | |||
<pre style="font-family:courier">screen -r stateframe</pre> | |||
to restore the current screen. Take a screen capture of the terminal window if there are any errors listed and send a copy to Owen or Dale. | |||
In either case once the screen is open change to the ~/Dropbox/PythonCode/Current directory: | |||
<pre style="font-family:courier">cd ~/Dropbox/PythonCode/Current</pre> | |||
Restart the stateframe display: | |||
<pre style="font-family:courier">python /common/python/current/sf_display.py &</pre> | |||
Press <CRTL>AD to exit from screen. | |||
Note that it will take several minutes for the display to come up. | |||
For more information on the screen command see http://www.ovsa.njit.edu/wiki/index.php/Owen%27s_Notes#Screen_Command | |||
== Computer Restart == | |||
=== Helios === | |||
To restart Helios, at a terminal enter the command | |||
<pre style="font-family:courier">sudo reboot now</pre> | |||
and wait about 5 minutes for it to restart. | |||
Open a terminal and start the dropbox server: | |||
<pre style="font-family:courier">python /home/sched/Downloads/dropbox.py start</pre> | |||
'''Important:''' Check to see if the time service is running. Enter the command: | |||
<pre style="font-family:courier">chronyc sourcestats</pre> | |||
If nothing is displayed, then the time service will need to be started by typing: | |||
<pre style="font-family:courier">sudo systemctl restart chrony.service</pre> | |||
Start the x11vnc server by typing: | |||
<pre style="font-family:courier">x11go</pre> | |||
Copy the acc0time.txt file to /tmp as follows: | |||
<pre style="font-family:courier">cp /home/sched/Dropbox/PythonCode/Current/acc0time.txt /tmp/</pre> | |||
Start the schedule as described here: http://www.ovsa.njit.edu/wiki/index.php/Owen%27s_Notes#Starting_the_schedule_window | |||
Start the Stateframe display as follows as described here: http://www.ovsa.njit.edu/wiki/index.php/Owen%27s_Notes#Restarting_the_Stateframe_Display | |||
Open up a new terminal tab and log into the DPP by typing: | |||
<pre style="font-family:courier">ssh user@dpp</pre> | |||
Now issue the command: | |||
<pre style="font-family:courier">ls /data1/IDB | tail 10</pre> | |||
Open up a new terminal tab and log into the DPP as above. | |||
View the SMP_AFFINITY.sh by typing the command: | |||
<pre style="font-family:courier">cat /home/user/test_svn/shell_scripts/SMP_AFFINITY.sh</pre> | |||
Note down the two CPU's that are in use. Issue the following commands: | |||
<pre style="font-family:courier"> | |||
ipython --pylab | |||
import dpp_plot_packets as dpp | |||
dpp.fix_packets(cpu = [cpu1, cpu2]) | |||
</pre> | |||
where cpu1 and cpu2 are the CPUs that were noted down earlier. | |||
=== DPP === | |||
'''<span style="color:#FF0000"> Tohbans contact Owen or Dale to reboot the DPP!</span>''' | |||
First, check that the 10 Gb ethernet interfaces are present, by typing the command: | |||
<pre style="font-family:courier">ifconfig</pre> | |||
which should show a list of interfaces including enp5s0 and enp7s0. If these are NOT present, type: | |||
<pre style="font-family:courier">sudo modprobe myri10ge</pre> | |||
to start the device driver. Then check again that these interfaces are present. | |||
==== Starting adc_plot ==== | |||
The adc_plot program will need to be restarted. To do this enter the command: | |||
<pre style="font-family:courier">/bin/bash /home/user/test_svn/shell_scripts/adc_plot.sh > /dev/null &</pre> | |||
==== Resetting the Interrupt Priority ==== | |||
The interrupt priority is now automatically reconfigured at startup. There is a 1 minute delay to allow drives to mount and other programs to load prior to the <span style="font-family:courier">dpp_fix_packets.py</span> program running. Output from the program can be viewed by accessing a DPP terminal and entering the command: | |||
<pre style="font-family:courier">screen -r fixpackets</pre> | |||
Significant information is also displayed on the stateframe display on Helios. | |||
==== Start Data Recording ==== | |||
To start data recording enter: | |||
<pre style="font-family:courier">rmlock</pre> | |||
==== Mounting the dppdata1 disk ==== | |||
Note also that if the DPP reboots it is likely necessary to mount its disk on Pipeline, otherwise the pipeline task will fail. To check, log in to Pipeline and type df. The dppdata1 disk should be present. If it isn't, issue the command from pipeline: | |||
<pre style="font-family:courier">sudo mount -a</pre> | |||
=== ACC === | |||
==== Rebooting the ACC ==== | |||
To reboot the ACC, you will need to cycle the power. Follow the instructions below. | |||
:From a web browser, goto the http://pdudigital.solar.pvt page. | |||
:Click on the Action button shown below. | |||
[[File:Pdudigital_actions.png]] | |||
:Then click on Loads. | |||
[[File:Pdudigital_loads.png]] | |||
:Click on Item 14 - ACC (Array Control Computer) | |||
[[File:Pdudigital_acc.png]] | |||
:Click on Cycle and then OK when prompted | |||
[[File:Pdudigital_acc_cycle.png]] | |||
==== Restarting the ACC software from windows ==== | |||
To bring the ACC back to operation, it needs to be reloaded from windows as detailed below. | |||
From the Windows machine, click on <span style="font-family:courier">Start</span> and then <span style="font-family:courier">NI LabVIEW 2015 SP1</span> and finally <span style="font-family:courier">EOVSA-LabVIEW 2015.lvproj</span>. Then from the Project Explorer Window click on <span style="font-family:courier">Targets</span> ==> <span style="font-family:courier">acc</span> to expand the acc items. Then right click on <span style="font-family:courier">acc</span> and then click on <span style="font-family:courier">Connect</span>. | |||
[[File:ACC_open.png]] [[File: ACC_Connect.png]] | |||
Now click on <span style="font-family:courier">Startup</span> => <span style="font-family:courier">ACC Master.vi</span> to open up the ACC Master VI window.Click on the white arrow at the top left of the window. | |||
[[File: ACC_master_option.png]] [[File: ACC_start.png]] | |||
You should see a series of "NO ERROR" messages scrolling in the Initialization Messages window. | |||
[[File:ACC_no_error.png]] | |||
Finally, from the project explorer window, right click on <span style="font-family:courier">acc</span> and then click on <span style="font-family:courier">Disconnect</span>. The ACC Master window can now be closed. | |||
[[File:ACC_Disconnect.png]] | |||
== Pausing and Adjusting the Schedule == | |||
=== Pausing the Schedule === | |||
Occasionally, it may be necessary to pause the schedule. Typically this will need to be done when a flare is in a progress (check here: http://ovsa.njit.edu/flaremon/XSP_latest.png), and observations need to continue. i.e you will not want to move to a calibration. To do this, simply click on Stop on the schedule window. The array will continue to observe the Sun until you click on go again. | |||
=== Adjusting the Schedule === | |||
At times it will be necessary to adjust the schedule, especially if it has been paused or a calibration missed (especially the skycaltest). To adjust the schedule follow the following steps: | |||
:<p>If the schedule is not stopped click on stop.</p> | |||
[[File: Sched_stop.png]] | |||
:<p>Click the items to adjust. These will be highlighted in grey.</p> | |||
[[File: Sched_select.png]] | |||
Select the time increment from the top of the schedule and press the up or down keys to adjust the scheduled time. | |||
[[File:Sched_timeadjust.png]] | |||
Once done, click on Go to resume the schedule. | |||
< | |||
=== Removing an Item from the Schedule === | |||
Occasionally, an item will need to be removed from the schedule, particularly if maintenance is being performed. To remove an item follow the procedure below. | |||
:<p>Click on Stop to stop the schedule.</p> | |||
:<p>From the menu bar Click on File and then Save</p> | |||
[[File: Schedsave.png]] | |||
:<p>Once the save dialogue box appears, just click on Save.</p> | |||
[[File: Schedsavedialog.png]] | |||
:<p>Using a text editor open the file <span style="font-family:courier">/home/sched/Dropbox/PythonCode/Current/solar.scd</span>. You should see the same list as in the schedule. An example is shown below.</p> | |||
<pre "font-family:courier"> | |||
2021-03-29 10:06:58 ACQUIRE 1229+020 | |||
2021-03-29 10:07:58 LOSELECT | |||
2021-03-29 10:10:58 PHASECAL_LO 1229+020 pcal_lo.fsq | |||
2021-03-29 10:30:58 HISELECT | |||
2021-03-29 10:31:58 PHASECAL 1229+020 pcal_hi-all.fsq | |||
2021-03-29 11:31:58 STOW | |||
2021-03-29 14:37:00 SUN | |||
2021-03-29 15:10:00 ACQUIRE 2253+161 | |||
2021-03-29 15:14:00 PHASECAL 2253+161 pcal_hi-all.fsq | |||
2021-03-29 15:40:00 PHASECAL 2253+161 solar.fsq | |||
2021-03-29 15:41:00 SKYCALTEST 2253+161 | |||
2021-03-29 15:45:00 SUN | |||
2021-03-29 17:00:00 GAINCALTEST | |||
2021-03-29 17:03:00 SUN | |||
2021-03-29 18:30:00 SOLPNTCAL solar.fsq solpnt.trj | |||
2021-03-29 18:35:00 SUN | |||
2021-03-29 19:50:00 ACQUIRE 2253+161 | |||
2021-03-29 19:54:00 PHASECAL 2253+161 pcal_hi-all.fsq | |||
2021-03-29 20:25:00 SUN | |||
2021-03-29 21:30:00 SOLPNTCAL solar.fsq solpnt.trj | |||
2021-03-29 21:35:00 SUN | |||
2021-03-30 00:10:00 ACQUIRE 0319+415 | |||
2021-03-30 00:14:00 PHASECAL 0319+415 pcal_hi-all.fsq | |||
2021-03-30 00:45:00 SUN | |||
2021-03-30 01:18:00 STOW | |||
2021-03-30 04:12:55 ACQUIRE 1229+020 | |||
2021-03-30 04:13:55 LOSELECT | |||
2021-03-30 04:16:55 PHASECAL_LO 1229+020 pcal_lo.fsq | |||
2021-03-30 04:36:55 HISELECT | |||
2021-03-30 04:37:55 PHASECAL 1229+020 pcal_hi-all.fsq | |||
2021-03-30 05:37:55 STOW | |||
</pre> | |||
:<p>Remove any lines that you need to and then save the file, overwriting the existing <span style="font-family:courier">solar.scd</span> file.</p> | |||
:<p>From the Schedule click on File and then Open and select the <span style="font-family:courier">solar.scd</span> file.</p> | |||
:<p>Once loaded click Go on the schedule to restart it.</p> | |||
'''<span style="color:#FF0000">Note that clicking <span style="font-family:courier">Today</span> on the schedule will overwrite any changes!</span>''' | |||
=== Viewing Schedules for any Date === | |||
A schedule can be viewed for any date using the procedure below. | |||
:Ensure you are logged into a helios terminal and in the <span style="font-family:courier">Dropbox/PythonCode/Current</span> directory. | |||
:Access ipython: | |||
:<pre style="font-family:courier">ipython --pylab</pre> | |||
:Enter the following commands: | |||
::<pre style="font-family:courier"> | |||
import whenup | |||
from util import Time</span> | |||
whenup.make_sched(t=Time('yyyy-mm-dd')) | |||
</pre> | |||
:where <span style="font-family:courier">yyyy</span> is the year, <span style="font-family:courier">mm</span> is the month and <span style="font-family:courier">dd</span> is the day. For example to view the schedule for 2021-08-26 you would enter: | |||
::<pre style="font-family:courier">whenup.make_sched(t=Time('2021-08-26'))</pre> | |||
:The output of this command is given below: | |||
<pre style="font-family:courier"> | |||
['2021-08-26 11:14:02 ACQUIRE 0319+415', | |||
'2021-08-26 11:15:02 LOSELECT', | |||
'2021-08-26 11:18:02 PHASECAL_LO 0319+415 pcal_lo.fsq', | |||
'2021-08-26 11:38:02 HISELECT', | |||
'2021-08-26 11:39:02 PHASECAL 0319+415 pcal_hi-all.fsq', | |||
'2021-08-26 12:39:02 STOW', | |||
'2021-08-26 14:14:00 SUN', | |||
'2021-08-26 15:10:00 ACQUIRE 0319+415', | |||
'2021-08-26 15:14:00 PHASECAL 0319+415 pcal_hi-all.fsq', | |||
'2021-08-26 15:40:00 PHASECAL 0319+415 solar.fsq', | |||
'2021-08-26 15:41:00 SKYCALTEST 0319+415', | |||
'2021-08-26 15:45:00 SUN', | |||
'2021-08-26 17:00:00 GAINCALTEST', | |||
'2021-08-26 17:03:00 SUN', | |||
'2021-08-26 18:30:00 SOLPNTCAL solar.fsq solpnt.trj', | |||
'2021-08-26 18:35:00 SUN', | |||
'2021-08-26 19:50:00 ACQUIRE 1229+020', | |||
'2021-08-26 19:54:00 PHASECAL 1229+020 pcal_hi-all.fsq', | |||
'2021-08-26 20:25:00 SUN', | |||
'2021-08-26 21:30:00 SOLPNTCAL solar.fsq solpnt.trj', | |||
'2021-08-26 21:35:00 SUN', | |||
'2021-08-27 00:10:00 ACQUIRE 1229+020', | |||
'2021-08-27 00:14:00 PHASECAL 1229+020 pcal_hi-all.fsq', | |||
'2021-08-27 00:45:00 SUN', | |||
'2021-08-27 01:36:00 STOW', | |||
'2021-08-27 04:50:02 ACQUIRE 2253+161', | |||
'2021-08-27 04:51:02 LOSELECT', | |||
'2021-08-27 04:54:02 PHASECAL_LO 2253+161 pcal_lo.fsq', | |||
'2021-08-27 05:14:02 HISELECT', | |||
'2021-08-27 05:15:02 PHASECAL 2253+161 pcal_hi-all.fsq', | |||
'2021-08-27 06:15:02 STOW'] | |||
</pre> | |||
If needed, this can be copied and pasted into the <span style="font-family:courier">solar.scd</span> file. This is especially useful if the schedule needs to be restarted towards the end of the day. In this case (depending on time of year), the schedule program may load the schedule for the following day. If this occurs and you want to resume the schedule, use <span style="font-family:courier">whenup</span> with the previous days date and copy the output into the <span style="font-family:courier">solar.scd</span> file. Make sure you remove all leading spaces, brackets, commas and quotes. Save the file and load the <span style="font-family:courier">solar.scd</span> from the schedule and click <span style="font-family:courier">GO</span>. | |||
== Checking the adc_plot.py Program == | |||
The <span style="font-family:courier">adc_plot.py</span> program controls the backend gains. This must remain running. To check if it running follow the following procedure: | |||
:From the DPP, issue the command: | |||
:<pre style="font-family:courier">ls /tmp/*.npy | tail</pre> | |||
:The list of files will be of the form <span style="font-family:courier">ADCplotYYYYMMDD_HHMM.npy</span>. The most recent date should be the current day's date. | |||
:If the file is not current then issue the command: | |||
:<pre style="font-family:courier">ps -elf | grep adc</pre> | |||
:The output of this command should look similar to: | |||
<pre style="font-family:courier"> | |||
0 S user 18108 23862 0 80 0 - 2900 wait 20:56 pts/2 00:00:00 /bin/bash /home/user/test_svn/shell_scripts/adc_plot.sh | |||
0 S user 18109 18108 35 80 0 - 708344 poll_s 20:56 pts/2 00:21:57 /common/anaconda2/bin/python /common/python/current/adc_plot.py | |||
1 S user 26081 1 0 80 0 - 7607 poll_s Mar30 ? 00:00:00 SCREEN -S adc_plot | |||
0 S user 27917 18481 0 80 0 - 3285 pipe_w 21:57 pts/6 00:00:00 grep --color=auto adc | |||
</pre> | |||
:If <span style="font-family:courier">/common/anaconda2/bin/python /common/python/current/adc_plot.py</span> is at the end of the line and the <span style="font-family:courier">.npy</span> file for the current day is NOT present then issue the command: | |||
:<pre style="font-family:courier">kill -9 #####</span> | |||
:where ##### is the PID, column 4 of the output above. | |||
:Then issue the command: | |||
:<pre style="font-family:courier">/bin/bash /home/user/test_svn/shell_scripts/adc_plot.sh</pre> | |||
:Wait about a minute and then run | |||
:<span style="font-family:courier">ls /tmp/*.npy | tail</span> | |||
:and ensure there is a <span style="font-family:courier">.npy</span> file for the current day. | |||
== Calibrations == | |||
=== Reference Calibration === | |||
Before a phase calibration can be done, a reference calibration needs to be performed, which will be subsequently used as the reference for the phase calibration. | |||
Either access Helios via VNC computer or login to pipeline. If using helios access a pipeline terminal. | |||
At the prompt type the following command: | |||
<pre style="font-family:courier">python /common/python/current/calwidget.py</pre> | |||
The following window will open up: | |||
[[File:calwidget.png|none|The calwidget window.]] | |||
In the date box near top right of the window type in or use the up and down arrows to select the previous days date and hit enter. | |||
Click on the first available scan that does not suffer from a Windscram. Windscrams are marked in red. If a windscram occurred for less than 20% of the scan then it will be marked in yellow and may still be usable. The example below shows a windscram at 22:14:05. | |||
[[File:calwidget_windscram.png|none|The calwidget window with windscram shown at 22:14:05 highlighted in red.]] | |||
Select the earliest calibration that does not have a windscram, and then click on 'Analyze as Refcal'. The Sigma map should now be populated as shown below: | |||
[[File:calwidget_lowband_good.png|none|The calwidget window with sigma map. It also shows power and phases for Antenna 1 and Frequency Band 12.]] | |||
The above chart is for the low-band (channels 1 to 12). Yellow blocks indicate bad or unavailable data. Bands 3 and 4 are excluded due to intense RFI at these frequencies. Antenna 5 currently is not operating well, and will be excluded from any analysis. The green blocks indicate that the data may be alright if some points are excluded. Purple blocks indicate the data is good. | |||
Also shown in the above plot is the power and phase for Antenna 1 and band 12. The blue points are the X-polarization and the orange points are the Y-polarization. These should be close to straight lines. | |||
In this case we need to exclude all of Antenna 5 from the calibration. First click on any block for antenna 5 in the range of band 1 to 12. Next check the box 'Apply to all bands'. Move the mouse over to either the Power or Phase plots (either works). We need to exclude all points. Move the mouse slightly before the first point in the chosen plot and press the 'A' key. A green line will appear. next move the mouse slightly past the last point and press the 'B' key. A red line will appear. The screen should look like the figure below. | |||
[[File:calwidget_lowband_timeflag_all_bands.png|none|The calwidget window with antenna 5 having all points flagged for all bands.]] | |||
Now click on 'Apply time flagging. All of antenna 5's bands should turn yellow. | |||
Once complete, select the associated high band calibration and then click on 'Analyse as refcal'. In this case bands 7 to 52 will be shown on the sigma map as shown in the figure below. | |||
[[File:calwidget_highband.png|none|The calwidget window with sigma map. It also shows power and phases for Antenna 8 and Frequency Band 34.]] | |||
Antenna 5 once again needs to be excluded using the procedure described above. In addition antenna 13 has problems from band 13 to 52. We will remove these channels from the analysis. Ensure 'Apply to all bands is unchecked and select 'Apply to all bands above selected one'. Select band 13. As before select all of the points by pressing 'a' and 'b' at the appropriate points (start and end of the plot). Click on 'Apply Time Flagging'. All of the bands from the selected band up should turn yellow as shown in the figure below. | |||
[[File:calwidget_time_flag1.png|none|The calwidget window with Antenna 5 excluded and most of Antenna 13 excluded.]] | |||
As can be seen, there are still 3 green squares. We can make these good by selecting each one and flagging bad samples. In this example I have selected Antenna 4, Band 23. | |||
Ensure all checkboxes are unchecked. Slelect the box for the antenna and band the you wish to time flag. select (using mouse and a and b keys) up to two ranges of points to exclude. pressing the x key will remove the most resent line chosen. Once you have flagged the ranges, click on 'Apply Time Flagging'. Hopefully the box will turn purple. If not you may need to select different ranges. | |||
The result of this procedure is shown below. | |||
[[File:calwidget_individual_time_flag.png|none|The result of time flagging an individual antenna and band. Antenna 4, Band 13 is now purple.]] | |||
Repeat this procedure for the remaining bad antennas and bands. | |||
Once completed, select one of the bands of the refcals from list on the left and then click on 'Set as Refcal'. The click on extend selection. NOw select the other refcal. Make sure both are highlighted. Click on 'Set as extended refcal'. Click on 'Save to SQL'. | |||
=== Phase Calibration === | |||
After the reference calibration has been done, the phase calibration can be performed. Click on a good calibration for the high band (one that has not had a windscram and has a reasonable duration). Not that Phase Cals are not performed using the low band. | |||
Then click on 'Analyze as Phasecal'. At the top of the screen click on the 'Sum Pha' tab. The important thing here is that the slopes look good. Below is an example display of the slopes. These slopes are with reference to the Refcal. | |||
[[File:calwidget_phasecal_orig.png|none|The calwidget window showing slopes for each antenna.]] | |||
In the above display, we can see that all of the slopes look good except for Antenna 4. note that we have excluded Antenna 5 from the observations as these have no reference cal. By moving the mouse over points on antenna 4 the channel is displayed as the x value in the bottom right of the window. In this case, channel 24 and above will be excluded. Ensure 'Apply to all bands above selected one' is checked and click on the antenna 4 and channel 24 box. Select all points and click on 'Apply time flagging' Once done, click on the 'Sum Pha' tab again to ensure the slope now looks okay (See figure below). Once satisfied click on 'Save to SQL'. | |||
[[File:calwidget_phasecal_slopefixed.png|none|The calwidget window showing slopes for each antenna with points excluded on Antenna 4.]] | |||
<span style="color:#FF0000">'''Note that source 1331+305 is a weak source, but at some times of the year it is the only one available. In this case there will be a lot of noise in the phase calibration. However it should still be usuable. Typically though, bands 40 and above will be need to be excluded.</span> | |||
==== Phase Cal has not been Processed ==== | |||
Occasionally the pipeline processing will not run properly. This may cause the phase data to no be processed properly. This will be indicated by strange durations on the phase cal window. | |||
Log in to pipeline and issue the command: | |||
<pre style="font-family:courier">cat /data1/processing/LOG/udb_process_log.txt_''yyyymmdd'' | tail</pre> | |||
where <span style="font-family:courier">''yyyymmdd''</span> is the year month and day of the calibration data. | |||
If more than 5 lines similar to the output shown below are present, then the lock file will need to be removed. | |||
<pre style="font-family:courier"> | |||
Fri Jan 22 15:35:01 2021 /data1/processing/udb_process.lock Exists, returning | |||
Fri Jan 22 15:40:02 2021 /data1/processing/udb_process.lock Exists, returning | |||
Fri Jan 22 15:45:02 2021 /data1/processing/udb_process.lock Exists, returning | |||
Fri Jan 22 15:50:02 2021 /data1/processing/udb_process.lock Exists, returning | |||
Fri Jan 22 15:55:02 2021 /data1/processing/udb_process.lock Exists, returning | |||
Fri Jan 22 16:00:02 2021 /data1/processing/udb_process.lock Exists, returning | |||
Fri Jan 22 16:05:02 2021 /data1/processing/udb_process.lock Exists, returning | |||
Fri Jan 22 16:10:01 2021 /data1/processing/udb_process.lock Exists, returning | |||
Fri Jan 22 16:15:02 2021 /data1/processing/udb_process.lock Exists, returning | |||
Fri Jan 22 16:20:02 2021 /data1/processing/udb_process.lock Exists, returning | |||
</pre> | |||
To remove the lock file simply type: | |||
<pre style="font-family:courier">rmlock</pre> | |||
Processing should then resume. | |||
=== Adjusting the Schedule for Missed Calibration === | |||
If at the start of the day the schedule had locked up and part of the calibration has been missed, it is possible to adjust the schedule so that the calibration is still performed by following the procedure below. | |||
:Stop the schedule by clicking on the <span style="font-family:courier">STOP</span> button on the schedule. | |||
:While holding down the shift key select the first 5 items in the schedule (<span style="font-family:courier">ACQUIRE, LOSELECT, PHASECAL_LO, HISELECT, PHASECAL</span>). | |||
:Ensure that <span style="font-family:courier">M</span> (for minutes) near the top of the schedule is selected. Click the <span style="font-family:courier">+1</span> button near bottom of the schedule so that the Acquire time is 1 or two minutes after the current time. | |||
:Then, if required, select either <span style="font-family:courier">STOW</span> or <span style="font-family:courier">SUN</span> and adjust the time so that the Phasecal after HiSelect runs for at least 20 minutes. <span style="color:#00F000">'''Note that you can find if a source is still visible by using the whatup program ( http://www.ovsa.njit.edu/wiki/index.php/Owen%27s_Notes#Whatup_Program )'''</span>. | |||
:Click <span style="font-family:courier">GO</span> on the schedule. | |||
=== System Gain Calibration === | |||
This procedure is designed to adjust the system gains. This should be performed weekly or whenever the calibrations become poor. The full details can be found at [http://www.ovsa.njit.edu/wiki/index.php/System_Gain_Calibration EOVSA System Gain Calibration]. The steps below are a summary of that page. | |||
The best time to perform this calibration is immediately after a Solar Point Calibration, as the antennas need to be taken off the sun. | |||
The dBm values in the power and attenuation section of the Stateframe display should be between 1 and 4. | |||
Initially click on the Stop button in the schedule window. | |||
From the Schedule window issue the following commands: | |||
<pre style="font-family:courier"> | |||
$scan-stop | |||
stow | |||
femauto-off | |||
femattn 0 | |||
$fem-init | |||
</pre> | |||
Wait approximately 1 minute for the new settings to update. The frontend power levels should be between 1-4 dBm. If they aren't then reissue the <span style="font-family:courier">$fem-init</span> command | |||
Then proceed with: | |||
<pre style="font-family:courier">$subarray1 ant1-14 | |||
dcmauto-off ant1-14 | |||
fseq-file solar.fsq | |||
fseq-on | |||
$capture-1s dcm | |||
</pre> | |||
Click on the Clear button and then the Go button. | |||
From a pipeline terminal issue the following commands | |||
<pre style="font-family:courier">ipython --pylab | |||
import roachcal | |||
tbl=roachcal.DCM_calnew('/dppdata1/PRT/PRTyyyymmddhhmmssdcm.dat',dcmattn=10,missing='ant15') | |||
</pre> | |||
In the above command yyyymmddhhmmss is the year, month, day, hour minute and second of the dcm file. Pressing tab will complete the filename. for the missing field, antenna 15 must be included. Add any other antennas that are not to be included on the gain calibration separated by spaces. | |||
Enter | |||
<pre style="font-family:courier">tbl</pre> | |||
to view the contents of the tbl variable that was just created. | |||
Band 1 has recently had bad attenuations. To use older good values for this band issue the command: | |||
<pre style="font-family:courier">tbl = roachcal.override(tbl, bandlist=[1])</pre> | |||
Other bands can be excluded by adding the bands to the bandlist (space separated). | |||
It is useful to compare the new table with an existing table to check for errors/glitches. To do this issue the command: | |||
<pre style="font-family:courier">roachcal.compare_tbl(tbl, t=Time('2020-05-08'))</pre> | |||
Replace the time with the previous days gain calibration. All of the differences should be close to zero. | |||
Finally: | |||
<pre style="font-family:courier"> | |||
import cal_header | |||
cal_header.dcm_master_tablesql(tbl) | |||
</pre> | |||
From the Schedule window click the Stop button and then the Go button. | |||
In the schedule command box enter the command | |||
<pre style="font-family:courier">$scan-start</pre> | |||
=== Frontend Benchtest === | |||
The Benchtest is performed whenever components are replaced in the receiver. For a description of how to service the receiver see [[http://www.ovsa.njit.edu/wiki/index.php/Owen%27s_Notes#Receiver_Trouble_Shooting_and_Repair]]. | |||
==== Setup ==== | |||
Connect the power meter to the receiver as described here [http://www.ovsa.njit.edu/wiki/index.php/Owen%27s_Notes#Connecting_the_Power_Meter]. | |||
Find the GPIB cable and connect it to the ACC. Run the cable into the lab and connect it to the power meter. | |||
[[File:ACC-GPIB.jpg]] [[File:PM-GPIB.jpg]] | |||
==== Performing the Calibration ==== | |||
Access the windows (win1) computer. | |||
From the Quicklaunch menu select the E4418B Measurement program. | |||
[[File:E4418B_ss.png]] | |||
This should bring up a screen as shown below: | |||
[[File:E4418B.png]] | |||
Change <span style="font-family:courier">Enum</span> to the appropriate antenna number. | |||
Change <span style="font-family:courier">Reading</span> to the appropriate polarisation. | |||
From the Helios computer open up the gedit program. | |||
Open the file <span style="font-family:courier">/home/sched/Dropbox/PythonCode/Current/FEMbenchtest.scd<span> | |||
Edit the first line so that the correct antenna is present. For example, if antenna 5 is to be calibrated then the first line should read similar to: | |||
<pre style="font-family:courier">1 2019-11-08 12:07:00 FEMBENCHTEST ant5</pre> | |||
Once edited, save and close the file. | |||
On the Schedule window click on Stop. | |||
Click on <span style="font-family:courier">File</span> and then <span style="font-family:courier">Open</span> | |||
[[File:Sched-open.png]] | |||
Select the <span style="font-family:courier">/home/sched/Dropbox/PythonCode/Current/FEMbenchtest.scd<span> file and open it. | |||
Click on <span style="font-family:courier">Today</span> | |||
From the Window computer, on the E4418B program click on <span style="font-family:courier">Start Logging Data</span> | |||
The computer should go through four sequences which display 4 block patterns on the plots in the E4418B program. | |||
Once completed click on <span style="font-family:courier">Stop</span> | |||
Repeat for the other polarisation if required. | |||
Remember to reload and restart the <span style="font-family:courier">Solar.scd</span> schedule. | |||
==== Loading the Calibration to the CRIO ==== | |||
The files created are located in the <span style="font-family:courier">Dropbox/EOVSA M&C/Test Data/</span> folder. | |||
Find the most recently created text files and open the first of them in a text editor. An example of a part of the file is shown below: | |||
[[File:Powcalfileeg.png]] | |||
This file need to be edited to remove all but one of the 5 lines for each attenuation. Typically choose the third entry in each data block. | |||
Once the file has been edited and saved, from pipeline change to the folder where the edited files are located. | |||
From ipython, enter the following commands: | |||
<pre style="font-family:courier"> | |||
import fem_cal as fc | |||
import crio | |||
fc.fem_cal(ant | |||
</pre> | |||
where ant is the antenna number for the particular calibration. | |||
The latest files for that antenna will be read, and a plot will appear for each polarization with both points and quintic fit. The parameters of the fits will be printed to the screen in a form that can be cut and pasted directly into the crio.ini file for the appropriate antenna | |||
To retrieve the crio.ini file for a given antenna issue the following command in ipython: | |||
<pre style="font-family:courier">crio.save_crio_ini(ant_str='ant#')</pre> | |||
where # is the antenna number. Press CRTL Z to exit ipython temporarily. | |||
Open the downloaded ini file in a text editor and copy the new coefficients into this file. Enter <span style="font-family:courier">fg</span> to get back into ipython. | |||
Finally enter the command | |||
<pre style="font-family:courier">crio.reload_crio_ini(ant_str='ant#')</pre> | |||
=== Update Antenna Pointing === | |||
==== 2m Antenna ==== | |||
Access the Pipeline Computer. | Access the Pipeline Computer. | ||
From the terminal: | From the terminal, start ipython: | ||
<pre style="font-family:courier">ipython --pylab</pre> | |||
Import the solpnt_x and Time libraries: | |||
<pre style="font-family:courier"> | |||
import solpnt_x as sx | |||
from util import Time | |||
</pre> | |||
Load up the solar pointing scans for a given date and time. | |||
<pre style="font-family:courier"> | |||
tsolpnt = Time('yyyy-mm-dd HH:MM:SS') | |||
solout = sx.solpnt_xanal(tsolpnt) | |||
</pre> | |||
To view the beam widths as a function of frequency for each antenna and polarisation: | |||
<pre style="font-family:courier">sx.solpnt_bsize(solout)</pre> | |||
[[File:Ant4 Bsize.png]] | |||
To obtain the pointing offsets: | |||
<pre style="font-family:courier">offsets = sx.solpnt_offsets(solout)</pre> | |||
This will display the current pointing positions of each antenna. Ideally each antenna should be pointing at the center of the disk. If particular antennas significantly deviate from the center then a correction can be made. | |||
[[File: Pointing_offsets.png]] | |||
[[File: Pointing_offsets2.png]] | |||
For example, the following command will adjust the pointing offsets for antennas 6 to 8, 10 and 13: | |||
<pre style="font-family:courier">sx.offsets2ants(offsets, ant_str='ant6 ant7 ant8 ant10 ant13')</pre> | |||
The newer antennas with the alt-az drives that have had tracking updated will need to be rebooted. From the Schedule Window issue the commands: | |||
<pre style="font-family:courier"> | |||
reboot 1 ant6-8</pre> | |||
tracktable sun_tab.radec 1 ant6-8 | |||
track ant6-8 | |||
</pre> | |||
The antenna pointing adjustment is typically performed once per month. | |||
===== Manually Changing Coefficients ===== | |||
Sometimes an antenna's pointing coefficients will be so far off that a normal pointing calibrations will not work. The coefficients can be reset to an earlier value by using the following procedure. | |||
From a helios terminal enter the following commands: | |||
<pre style="font-family:courier"> | |||
ipython --pylab | |||
from util import Time | |||
import dbutil as db | |||
trange = Time([datestr1,datestr2]).lv.astype(int) | |||
query = 'select Timestamp,Ante_Cont_PointingCoefficient1,Ante_Cont_PointingCoefficient7 from fV66_vD15 where I15 = # and (cast(Timestamp as bigint) % 86400) = 100 and Timestamp between ' + str(trange[0]) + ' and ' + str(trange[1]) + ' order by Timestamp' | |||
data, msg = db.do_query(cursor,query) | |||
n = len(data['Timestamp']) | |||
for i in range(n): | |||
print Time(data['Timestamp'][i],format='lv').iso,data['Ante_Cont_PointingCoefficient1'][i],data['Ante_Cont_PointingCoefficient7'][i] | |||
</pre> | |||
Here <span style="font-family:courier">datestr1</span> and <span style="font-family:courier">datestr</span> is the range of times that are to be searched in the form <span style="font-family:courier">yyyy-mm-dd HH:MM</span> and <span style="font-family:courier">#</span> is the antenna number-1 | |||
The above code will display a list of pointing coefficients. Select a suitable pair and then from the schedule issue the commands: | |||
<pre style="font-family:courier"> | |||
pointingcoefficient1 xxx ant# | |||
pointingcoefficient7 xxx ant# | |||
</pre> | |||
where <span style="font-family:courier">xxx</span> are the new pointing coefficients and :<span style="font-family:courier">#</span> is the antenna number. | |||
==== Star Pointing for the 2m Antennas ==== | |||
Occassionaly, the normal 2m antenna pointing calibration will not work as this only adjusts 2 of the 9 antenna parameters. A more rigorous technique by taking images of stars can be performed. | |||
To begin with an optical telescope must be attached to the side of the dish that needs adjustment. The telescope and camera will need to be shipped from NJIT. Find the mounting bracket and attach this to the dish and then attach the telescope to the bracket as shown in the figures below. | |||
[[File:Optical-telescope-Mounting-Bracket.jpg]] [[File:Optical-telescope-on-dish.jpg]] | |||
Next the telescope needs to be aligned. It does not need to be perfect, but does need to be reasonable close. Ensure the antenna is tracking the sun. Hold your hand below the telescope, beyond the focal point. <span style="color:#FF0000">'''DO NOT PLACE YOUR HAND AT THE FOCUS AS YOU MAY GET BURNT!'''</span> | |||
You should see a bright disk surrounded by a dark ring. The disk should be centered and the ring should be a uniform size. Adjust the alignment of the telescope, by tightening and loosening the bolts on the mounting bracket. | |||
From a helios terminal change to the <span style="font-family:courier">/Dropbox/PythonCode/Star\ Pointing</span> folder. | |||
Enter the following commands: | |||
<pre style="font-family:courier"> | |||
ipython --pylab | |||
import readbsc as rb | |||
rb.do_stars(Y,M,D,h,m,npts=n) | |||
</pre> | |||
where Y,M,D,h,m are the year, month, day, hour, minute and second of the start of the observations, and npts is the number of points to observe (you will probably need about 50). | |||
Note that it is a good idea to set the start time well after dark. As soon as you start the appropriate scd file, the antenna will go immediately to the first source. | |||
Enter <span style="font-family:courier">cd ../Current</span> to change to the <span style="font-family:courier">Current</span> folder. | |||
Enter <span style="font-family:courier">nano STARS.ctl</span> to edit this file. You should see text similar to: | |||
<pre style="font-family:courier"> | |||
$SCAN-STOP | |||
SUBARRAY1 ant7 | |||
TRACKTABLE startracktable.radec | |||
TRACK | |||
</pre> | |||
Change the antenna number to the antenna that the telescope is attached to. Press [CRTL X] to exit and press [Y] to save the file. | |||
Enter <span style="font-family:courier">nano starpointing.scd</span> to edit the starpointing.scd file (example below). | |||
<pre style="font-family:courier"> | |||
2021-05-30 03:30:00 STARS | |||
2021-05-30 09:30:00 REWIND | |||
</pre> | |||
Change the date to the date at which you want to start observations. Press [CRTL X] to exit and press [Y] to save the file. | |||
From the windows laptop find the <span style="font-family:courier">kjell-lap/Dropbox/PythonCode/Star Pointing</span> folder. Create a folder with date that the observations will be taken in the form yyyy-mm-dd. | |||
Double click on the ASIImg Icon. On the right, scroll down to find the path where the images are to be stored. Click on the folder icon and then select the folder you just created. | |||
Once the last phasecal of the day has been completed, go outside to the antenna where the telescope is connected with the laptop and a small table. Connect the laptop using an extension cord to the power point and connect the camera to one of the USB ports on the laptop. Remove the lens cap from the telescope and move the focus to the mark on the telescope. | |||
If it is not already open double click on the ASIImg icon. | |||
[[File:ASIImg_icon.png]] | |||
This will bring up the window shown below. Within this window click on the ASIImg Icon. | |||
[[File:ASIImg_ASIImg_icon.png]] | |||
This will bring up the capture window as shown below. The controls for the camera are on the right of the window. | |||
[[File:ASIImg capture window.png]] | |||
Scroll down a little on the control section until you find the Path. Click on the folder Icon (marked in red). | |||
[[File:ASIImg_path_select.png]] | |||
In the file dialog box, ensure that you are in the <span style="font-family:courier">Dropbox/PythonCode/Star Pointing</span> folder. Right click on the file dialog window and select <span style="font-family:courier">New</span> and then <span style="font-family:courier">Folder</span>. Enter a folder name in the form of yyyy-mm-dd , using the current UT days's date. | |||
[[File:ASIImg_select_folder_dialog.png]] | |||
Scroll back up and click on the small red play arrow (marked in the red box below) to connect to the camera. | |||
[[File:ASIImg_connect_button.png]] | |||
Click on the preview button if it is not already highlighted. | |||
[[File:ASIImg_preview_button.png]] | |||
Set the Exposure time. Initially, if there is still some light set it to 1 second, as it darkens you can increase the exposure time gradually up to 10 seconds. | |||
[[File:ASIImg_Exposure.png]] | |||
Select on continuous. | |||
[[File:ASIImg_Continuous.png]] | |||
Click on the large play button. This will change to a stop button.The camera status bar at the bottom should continually update. If it hangs click the stop button and then click the play button again. | |||
[[File:ASIImg_play.png]] [[File:ASIImg_stop.png]] | |||
By scrolling down on the right, you will be able to see a histogram. In addition, in the left pane you will be able to see the most recently captured image. As it gets dark carefully adjust the focus so that the stars are as focused as possible. Once this is done, place the lens cap on the end of the telescope. | |||
Stop the camera from previewing by clicking the stop button. | |||
To take dark frames, click Capture, and then Auto Run. | |||
[[File:ASIImg_capture_button.png]] [[File:ASIImg_autorun.png]] | |||
A new window will open up as shown below: | |||
[[File:ASIImg_autorun_window.png]] | |||
Click on the tab below Ordinal and select Dark. Click on the arrow below the Exposure tab and select 10. Click on Frames and change this to 10. | |||
[[File:ASIImg_Captue_Select_Dark.png]] [[File:ASIImg_Captue_Select_Exposure.png]] [[File:ASIImg_Frames.png]] | |||
Click on Start. When prompted to Enable Cooler, click No. | |||
[[File:ASIImg_Captue_Start.png]] [[File:ASIImg_Captue_Cooler.png]] | |||
Once done, remove the lens cap from the telescope. You can now go inside and log into the laptop via VNC (IP Address: 192.168.24.184:0, the password is the same as for Helios). | |||
Once logged in click on the Reset Button. | |||
[[File:ASIImg Captue Reset.png]] | |||
Now change the Ordinal to Light and set the Frames to 1100 | |||
From the Schedule click on File and then Open. Select the starpointing.scd file and then click on GO. | |||
Once the start time of the has been reached, you can click Start on the ASIImg capture window and select No when it prompts to enable cooling. You can now close down the capture Window. | |||
It will now automatically capture images. | |||
Once observing has finished and before the antenna moves to the sun remove the telescope from the antenna or place the lens cap on the end of the telescope, or place the antenna in Stow and power off the antenna controller (new antennas) or CRIO (old antennas) at the Viking Unit. <span style="color:#FF0000">'''DO NOT ALLOW THE TELESCOPE TO POINT AT THE SUN WITHOUT THE LENS CAP ON!'''</span> | |||
Bring in the telescope, laptop, cables and camera to the EOVSA building. | |||
Reconnect the windows laptop and then select from the Quickstart menu select <span style="font-family:courier">MaxIm DL 5</span>. | |||
[[File:Quickstart-MaximDL5.png]] | |||
From the <span style="font-family:courier">Process</span> Menu, select <span style="font-family:courier">Set Calibration</span>. | |||
[[File:MaxIm-Set Cal.png]] | |||
Click on the Folder Icon. | |||
[[File:MaxIM-Select Folder.png]] | |||
Select the folder with the dark frames. This will be under the folder you created earlier, and should be the first of two folders. Once Selected, Click <span style="font-family:courier">OK</span>. | |||
[[File:MaxIm-Select Darks.png]] [[File:MaxIm-Select Darks-OK.png]] | |||
==== 27m Antenna ==== | |||
<p style="color:#FF0000">Only do this if absolutely required. The 27m pointing should only need to be performed at most on an annual basis. It takes 24 hours to complete. If possible, schedule the pointing when there are few active regions on the sun</p> | |||
From a helios terminal, view the <span style="font-family:courier">calpnt48.scd</span> file by issuing the command: | |||
<pre style="font-family:courier">cat /home/sched/Dropbox/PythonCode/Current/calpnt48.scd</pre> | |||
Below are the first few lines of this file: | |||
<pre style="font-family:courier"> | |||
2019-06-22 10:26:00 ACQUIRE 2136+006 | |||
2019-06-22 10:30:00 CALPNTCAL 2136+006 band21.fsq calpnt.trj | |||
2019-06-22 10:55:00 ACQUIRE 2253+161 | |||
2019-06-22 10:59:00 CALPNTCAL 2253+161 band21.fsq calpnt.trj | |||
2019-06-22 11:24:00 ACQUIRE 2136+006 | |||
2019-06-22 11:28:00 CALPNTCAL 2136+006 band21.fsq calpnt.trj | |||
2019-06-22 11:53:00 ACQUIRE 2253+161 | |||
2019-06-22 11:57:00 CALPNTCAL 2253+161 band21.fsq calpnt.trj | |||
</pre> | |||
The dates and times need to be edited. Use the following equation to compute the new times: | |||
<pre style="font-family:courier"> | |||
OFFSET = NST - OST | |||
NT = OT + OFFSET | |||
</pre> | |||
where NST is the sidereal time when you wish to start the calibration, OST is the sidereal time for the first entry in the <span style="font-family:courier">calpnt48.scd</span> file, NT is a new UT time in the schedule, and OT is the old UT time in the schedule. | |||
The <span style="font-family:courier">/home/sched/Dropbox/PythonCode/Current/update_calpnt48.py</span> file contains a function that will automatically create a new <span style="font-family:courier">calpnt48.scd</span> file. To use it issue the following commands from a Helios terminal: | |||
<pre style="font-family:courier"> | |||
cd /home/sched/Dropbox/PythonCode/Current/ | |||
ipython --pylab</p> | |||
from util import Time</p> | |||
import update_calpnt48 as ucp | |||
ucp.update_calpnt48(t2 = Time("yyyy-mm-dd hh:mm")) | |||
</pre> | |||
where yyyy-mm-dd hh:mm is the approximate UT start date and time for the calibration. If the time is omitted then the current time will be used. | |||
This program will overwrite the <span style="font-family:courier">calpnt48.scd</span> file. The previous file will be saved as <span style="font-family:courier">calpnt48.scd.bak</span> | |||
Sources will be replaced if they are outside the following ranges: | |||
:<p>HA: -55 to +55 degrees</p> | |||
:<p>Alt: Greater than +10 degrees</p> | |||
:<p>Az: 35 to 325 degrees</p> | |||
A sample screen output of the program is shown below: | |||
[[File:Update_calpnt48_output.png]] | |||
If you just want to see the screen output without overwriting the existing <span style="font-family:courier">calpnt48.scd</span> file issue the command from ipython: | |||
<pre style="font-family:courier">ucp.update_calpnt48(t2 = Time("yyyy-mm-dd hh:mm", overwrite=False))</pre> | |||
Once run, type <span style="font-family:courier">exit</span> to exit ipython. | |||
Load the new <span style="font-family:courier">calpnt48.scd</span> file into the schedule and start it. Let it run for about 24 hours. | |||
=== Adjusting Antenna Delays === | |||
'''<span style="color:#FF0000"> Note: Only perform this procedure if absolutely necessary! This should be done either after the evening calibration or before the morning calibration.</span>''' | |||
==== Using the Delay Widget ==== | |||
From pipeline, start the delay widget as follows: | |||
<pre style="font-family:courier">python /common/python/current/delay_widget.py</pre> | |||
A window similar to the one shown below should appear: | |||
[[File:Delay_widget_startup.png]] | |||
At the top right, click on <span style="font-family:courier">File</span> and then <span style="font-family:courier">Open npz file</span> | |||
Select the most recent file. | |||
You will see a screen that looks similar to that below: | |||
[[File: Delay_Widget_File_Loaded.png]] | |||
Note that if you had a file loaded and different antenna selected, the program will default to antenna 1 but not change the number in the Antenna box. | |||
Select the antenna for which the delays are to be checked. | |||
For the four panels on the left, each cluster of points represents a band. Each cluster in the XY and YX plots needs to be as flat as possible. Also the XX-YY plot on the right need to have all points as flat as possible. The slopes can be adjust by incrementing or decrementing the X delays on the left of the screen. | |||
Repeat this process for any other antennas. | |||
The following should be noted if adjusting the delays on antenna 1: | |||
:Adjusting the delays on antenna 1 is essentially the same as adjusting the delays on antenna 14 as antenna 1 is used as a reference for the other antennas. If delays on antenna 1 are adjusted, they will need to be adjusted on all other antennas. | |||
:You will also need to adjust the low frequency delays on antenna 1, but no other antennas. | |||
Once done the new delays can be save from the File menu. | |||
'''<span style="color:#FF0000">Only save the new delays if you are absolutely certain changes need to be made!</span>''' | |||
Click on <span style="font-family:courier">Exit</span> to close the application. | |||
==== Checking that the delays were updated ==== | |||
To see if the delays were updated, perform the following procedure. | |||
From pipeline access ipython: | |||
<pre style="font-family:courier">ipython --pylab</pre> | |||
Load the cal_header and and Time modules: | |||
<pre style="font-family:courier"> | |||
import cal_header as ch | |||
from util import Time | |||
</pre> | |||
We want to use the dla_censql2table function to create a table of the delays. This is done by: | |||
<pre style="font-family:courier">ch.dla_cen2sqltable(t=Time('yyyy-mm-dd hh:mm'),acc=False)</pre> | |||
where <span style="font-family:courier">yyyy-mm-d hh:mm</span> is the date and time for the last delays (it will look for the first time prior to that specified) and <span style="font-family:courier">acc=False</span> tells the function not to send values to the ACC. | |||
For example to view delays from the 3rd of November 2020 (or the first date prior to this) you would issue the command: | |||
<pre style="font-family:courier">ch.dla_cen2sqltable(Time('2020-11-01 01:00'),acc=False)</pre> | |||
Note that this writes the data to a text file: <span style="font-family:courier">/tmp/delay_centers.txt</span> | |||
To view this file issue the command: | |||
<pre style="font-family:courier">!cat /tmp/delay_centers.txt</pre> | |||
To view an older file, use the <span style="font-family:courier">ch.dla_cen2sqltable</span> with an earlier time and reissue the cat command. The delays that were changed should be different for the given antennas. Note that if antenna 1 delays were changed, this change will be shown in antenna 14. | |||
== Updating SQL Database on the Cloud == | |||
'''Note that you must have a .netrc file in your home on pipeline folder and the permissions set correctly for this to work''' | |||
When running for the first time, add the following lines to your .bashrc file: | |||
<pre style="font-family:courier"> | |||
alias loadpyenv3.8='source /home/user/.setenv_pyenv38' | |||
alias loadctl='source /home/user/.setenv_ctl' | |||
</pre> | |||
To create new entries for the cloud data base, from your pipeline account run the following commands: | |||
<pre style="font-family:courier"> | |||
bash | |||
loadctl | |||
ipython | |||
import eovsactl.sql2mysql as s2m | |||
s2m.sync2mysql() | |||
s2m.sqltable2mysql('abin',host='amazonaws.com') | |||
s2m.sqltable2mysql('abin',host='localhost') | |||
</pre> | |||
The commands above will create a .sql file at /data1/ | |||
To send it to the cloud type: | |||
<pre style="font-family:courier"> | |||
!mysql -h eovsa-db0.cgb0fabhwkos.us-west-2.rds.amazonaws.com -u admin -p eOVSA < /data1/yyyy-mm-dd.sql | |||
</pre> | |||
The password is the last one in the .netrc file | |||
To check if the file was sent to the cloud, use the python command: | |||
<pre style="font-family:courier"> | |||
s2m.get_latest_timestamp() | |||
</pre> | |||
== Reprocessing Pipeline Data == | |||
Occassionally, pipeline data will need to be reprocessed if it failed or there were bad calibrations. | |||
=== Creating full disk images === | |||
Log in to a pipeline terminal and create a new screen: | |||
<pre style="font-family:courier"> | |||
screen -S fulldisk | |||
</pre> | |||
Next run the following command: | |||
<pre style="font-family:courier"> | |||
/bin/bash /common/python/eovsapy/shellScript/pipeline.sh -c 1 yyyy mm dd > /tmp/test_pipeline.log | |||
</pre> | |||
where <span style="font-family:courier">yyyy</span> is the year, <span style="font-family:courier">mm</span> is the month and <span style="font-family:courier">dd</span> is the day of the data to be processed. | |||
This will take several hours to run. | |||
When completed run the command: | |||
<pre style="font-family:courier"> | |||
/bin/bash /common/python/eovsapy/shellScript/pipeline_plt.sh -c 1 -e 1 yyyy mm dd > /tmp/test_pipeline_plt.log | |||
</pre> | |||
This should only take a few seconds to run. | |||
Finally run the following command: | |||
<pre style="font-family:courier"> | |||
/bin/bash /common/python/eovsapy/shellScript/pipeline_compress.sh -n 1 -O 1 yyyy mm dd > /tmp/test_pipeline_compress.log | |||
</pre> | |||
Note you can reprocess multiply days by running each day in a separate screen. Remember to assign a different name to each screen and assign a different name to each log file. | |||
=== Total Power Calibration === | |||
To check if a total power calibration has been done on a particular day follow the steps below from a pipeline terminal | |||
<pre style="font-family:courier"> | |||
ipython --pylab | |||
import cal_header as ch | |||
from util import Time | |||
from stateframe import extract | |||
xml, buf = ch.read_cal(10, Time('yyyy-mm-dd 20:00')) | |||
outtm = Time(extract(buf, xml['SQL_timestamp']), format='lv').iso | |||
Time(extract(buf, xml['SQL_timestamp']), format='lv').iso | |||
outtm | |||
</pre> | |||
where <span style="font-family:courier">yyyy</span> is the year, <span style="font-family:courier">mm</span> is the month, <span style="font-family:courier">dd</span> is the day. | |||
The return time should be 20:00 on the date specified. If not then copy the record to the correct time as follows: | |||
<pre style="font-family:courier"> | |||
ch.copy_cal(10,Time(outtm),Time('yyyy-mm-dd 20:00')) | |||
</pre> | |||
To rerun the Total Power calibration, exit ipython and enter the command: | |||
<pre style="font-family:courier"> | |||
/bin/tcsh /home/user/test_svn/shell_scripts/pipeline_allday_fits.csh --clearcache 2023 10 16 > /tmp/test_pipeline_fits.log | |||
</pre> | |||
== Trouble Shooting == | |||
=== General Problems === | |||
==== Temperature Controller ==== | |||
Occassionally a front end temperature will show an error. This is usually because the temperature controller that reports the temperature has locked up. To fix this type the following command in the Schedule window: | |||
<pre style="font-family:courier">tec$bc ant#</pre> | |||
where # is the antenna number that needs the temperature controller rebooted. | |||
To clear the temperature error history (that updates every minute) issue the command: | |||
<pre style="font-family:courier">tec$sc ant#</pre> | |||
If the above steps do not work, the following command can be issued: | |||
<pre style="font-family:courier">$pcycle fem ant#</pre> | |||
This will recycle power to the front end controller. If this does not work you can check the log file from a helios terminal by typing | |||
<pre style="font-family:courier">tail -20 /tmp/schedule.log</pre> | |||
A display similar to that below will be shown: | |||
<pre style="font-family:courier"> | |||
2020-08-17 13:56:03.002 Ant4 attempt #1 to login. | |||
2020-08-17 13:56:03.002 Ant4 Login failed with status code: 401 | |||
2020-08-17 13:56:04.002 Ant4 attempt #2 to login. | |||
2020-08-17 13:56:04.002 Ant4 Login successful. | |||
2020-08-17 13:56:04.002 Ant4 Fronttend now off | |||
2020-08-17 13:56:19.002 Ant4 attempt #1 to login. | |||
2020-08-17 13:56:19.002 Ant4 Login successful. | |||
2020-08-17 13:56:20.002 Ant4 Frontend now on | |||
</pre> | |||
Note that the second line says that the login failed. It will attempt a login in three times. | |||
If this fails you can attempt a recycle to issue the command again. If this does not work the front end needs to be reset at the auxiliary box at the antenna. This is done by switching off the two breakers, waiting 10 seconds and then switching them back on. The breakers are shown below. | |||
[[File:auxboxbreakers.jpg]] | |||
==== Packet Loss on DPP ==== | |||
The packet loss monitoring has now largely been automated. However it is still a good idea to check to make sure everything is running smoothly. | |||
Details on the new programs and procedures can be found here: http://www.ovsa.njit.edu/wiki/index.php/Owen%27s_Notes#DPP_Fix_Packets_Details | |||
==== Data Recording on the DPP has Stopped ==== | |||
To Check if the DPP is recording data, from a DPP terminal issue the command: | |||
<pre style="font-family:courier">ls /data1/IDB |tail</pre> | |||
This will display the last 10 IDB files that were created. They should have a time stamp about 10 minutes apart and the last file should only be 10 minutes or so old. | |||
If current IDB files are not displayed then firstly check to see if The STATE is On in the phase tracking section of the stateframe is displayed as shown below. | |||
[[File:Sf display state.png]] | |||
If the state is off then simply click Stop on the schedule window and then click on Go. The state should return to On. Check to see if the DPP is creating files after about a minute. | |||
If the DPP is still not recording data or the State was already on then follow the instruction below. | |||
:Log in to the DPP computer (user@dpp). | |||
:Enter <span style="font-family:courier">top</span> . A display similar to that below should be shown. | |||
[[File:Dpp_top.png]] | |||
:Look for <span style="font-family:courier">dppxmp</span> under “command” column (shown here in the red box). If this is present not the PID# (shown here in the green box. Note that this number will change if dppxmp is restarted). | |||
:Press 'q' to exit the <span style="font-family:courier">top</span> program | |||
:If <span style="font-family:courier">dppxmp</span> is present issue the command: | |||
<pre style="font-family:courier">kill pid#</pre> | |||
:where PID# is the number noted down previously. This will stop the <span style="font-family:courier">dppxmp</span> program. | |||
:Enter the command <span style="font-family:courier">rmlock<span style="font-family:courier"> | |||
:Check again to see if data recording has recovered | |||
:Type “rmlock" on DPP terminal. Check if the data recording has recovered by sending <span style="font-family:courier">ls /data1/IDB |tail</span> | |||
==== Restarting the Schedule ==== | |||
If the schedule needs to be restarted then follow the steps below: | |||
:Click Stop and then Clear. | |||
:Click Today and then Go. | |||
==== Pipeline Problems ==== | |||
If there is no data showing at [http://www.ovsa.njit.edu/browser/ http://www.ovsa.njit.edu/browser/] then something has gone wrong with the pipeline processing. Below is a image of what the webpage looks like when an error has occurred. | |||
[[File:eovsa_browser_nodata.png|none|The 'No Data' errors on the EOVA browser page.]] | |||
Clicking on the Newest button will refresh the page and upload the latest data. If this does not correct the problem take a note of the date in the web address of the page. Then click on 'Today's Data'. A list of fits files should appear as below: | |||
[[File:eovsa_browser_files.png|none|Example list of files if pipeline processing was successful.]] | |||
To check to see why the images are not visible, the log files can be inspected. Log on to pipeline and type the command: | |||
<pre style="font-family:courier">crontab -l</pre> | |||
The image below show a part of the output. The portion in the red box is the script that generates the full disk image. | |||
[[File:Pipeline_crontab_fdimg.png]] | |||
To view the programs run by this script issue the command: | |||
<pre style="font-family:courier">cat /common/python/suncasa/shellScript/pipeline_fdimg.bash</pre> | |||
and an output similar to that below should be produced: | |||
[[File:Pipeline_fdimg_script.png]] | |||
Note that the are three log files produced: <span style="font-family:courier">/tmp/pipeline.log</span>, <span style="font-family:courier">/tmp/pipeline_plt.log</span> and <span style="font-family:courier">/tmp/pipeline_compress.log</span>. | |||
By inspecting these files you should be able to determine at what point an error occurred. To view these files type: | |||
<pre style="font-family:courier">cat [logfile]</pre> | |||
where [logfile] is the name of the logfile you wish to view. | |||
==== Bad Front End Attenuation Values ==== | |||
The front end power values on both the horizontal and vertical channels should be between about +1 dBm and +4 dBm. These can be found on the stateframe display as shown below. | |||
[[File:Sf display attn.png]] | |||
If the power deviates significantly from the 1 to 3 dBm range (unless there is a burst in progress or a gaincal test being performed) then the attenuations can be adjusted by issuing the following commands from the Schedule window: | |||
<pre style="font-family:courier">hattn first second ant#</pre> | |||
where first and second are the attenuations of the first and second attenuators for the horizontal polarization and ant# is the antenna number. Note that first should always be zero. | |||
Similarly to adjust the vertical attenuators: | |||
<pre style="font-family:courier">vattn first second ant#</pre> | |||
'''Note that no warning will be shown if the power deviates significantly from the acceptable range.''' | |||
==== Warning on Power and Attenuation ==== | |||
On the state frame display in the Power and Attenuation section, occasionally an antenna will turn yellow (warning). This will usually be because the 1st attenuator value is not zero. This will occur during a gaincaltest or a burst. The value should be even. If the value is 9, then the CRIO file will most likely need to be be reloaded. | |||
Follow the instructions here http://www.ovsa.njit.edu/wiki/index.php/Owen%27s_Notes#Reloading_the_crio.ini_File to relaod the crio.ini file | |||
==== Error on Power and Attenuation ==== | |||
On the state frame display in the Power and Attenuation section, occasionally an antenna will turn red (error). This may happen during a gaincal. However If it occurs outside a gancal and the Power values are reading <span style="font-family:courier">nan</span> (Not a Number), then it is possible that communications have been lost at the front end. You can try and cycle power to the front end by issuing the command from schedule: | |||
<pre style="font-family:courier">$pcycle fem ant#</pre> | |||
If the $pcycle command does not work you can try testing the network connection. From a helios terminal, issue the command: | |||
<pre style="font-family:courier">ping ant#.solar.pvt</pre> | |||
where # is the number of the antenna. If you get a message similar to: | |||
<pre style="font-family:courier">From helios.solar.pvt (192.168.24.103) icmp_seq=1 Destination Host Unreachable</pre> | |||
then it means that the communications are down. Contact Owen to reset the power at the antenna. | |||
==== Resetting Attenuation Values ==== | |||
Occasionally, the front end attenuation values may get stuck, typically after a calibration. To reset the attenuations, use the following commands on the schedule: | |||
<pre style="font-family:courier">femauto-off ant# | |||
femattn 0 0 ant# | |||
</pre> | |||
==== Schedule Commands not Working ==== | |||
If schedule commands are not working then the ACC may need to be restarted. | |||
To determine if the ACC needs restarting issue a command from Schedule. At the top right of the Stateframe the 'Task' should be updated. if it is not then follow the following procedure: | |||
:Go to the Windows computer and from the Quicklaunch menu select 'EOVSA E&C'. | |||
:Once running click on 'Reset ACC' and wait about 10 seconds. | |||
==== Queue Overflow Error ==== | |||
On the Stateframe display, a 'Queue Overflow' Error may occur under the Frequency Tuning bar. To correct this issue type the following command into the Raw Command box on the schedule: | |||
<pre style="font-family:courier">lo1a-reboot</pre> | |||
Stop and then restart the schedule. | |||
==== Bright Scram ==== | |||
A bright scram occurs when the dish becomes more reflective, usually due to ice or water. This will cause more heat to be focused which can result in damage to the feed (burnt feed). A bright scram moves the dish 10 degrees off the Sun. It will the periodically move back to the Sun and remain tracking once the temperature at the feed drops sufficiently. | |||
'''<span style="color:#FF0000">ONLY PERFORM THE PROCEDURE BELOW IF YOU ARE ABSOLUTELY SURE THAT A BRIGHT SCRAM IS FALSE AND REALLY NEEDS TO BE CLEARED. YOU RISK BURNING THE FEED!''' | |||
A bright scram can be cleared by issuing the following command from the schedule: | |||
<pre style="font-family:courier">bscram-clear ant#</pre> | |||
If an antenna is performing brightscrams erroneously (for example during a phasecal), then an individual antenna can have the brightscram disabled by issuing the following command from the schedule: | |||
<pre style="font-family:courier">bscram-off ant#</pre> | |||
To re-enable brightscram on a particular antenna issue the command: | |||
<pre style="font-family:courier">bscram-on ant#</pre> | |||
==== Older Antennas Not Tracking ==== | |||
The older antennas (9-11 and 13) will occasionally seem to stop tracking. This is usually because it has lost where it is pointing. It will move incredibly slowly until it reaches its limit before returning to regular tracking. This process cant take up to about 20 minutes. If it has not resolved it tracking problems in this time, proceed with normal trouble shooting. | |||
==== Antenna Trouble Shooting ==== | |||
If an antenna in the State-frame Antenna Tracking section is highlighted red, go through the following list. | |||
===== Reloading the track table ===== | |||
Reload the track table as by issuing the following commands from the schedule | |||
<pre style="font-family:courier">tracktable sun_tab.radec ant# | |||
track ant# | |||
</pre> | |||
Note that omitting the ant# will resend the commands to all antennas. You can specify more that on antenna. | |||
===== Stowing the antennas ===== | |||
Attempt to stow the antenna by issuing: | |||
<pre style="font-family:courier">stow ant#</pre> | |||
If there are still errors, from the state-frame display, click on the antenna display and then click on the tab for the appropriate antenna. | |||
===== Antenna at its limits (New Antennas) ===== | |||
If a limit is highlighted you will need to move the antenna from its limit. Firstly issue the command: | |||
<pre style="font-family:courier">runmode 2 ant#</pre> | |||
Issue the appropriate command according to the following table: | |||
{| class="wikitable" | |||
! Co-ord || Limit || Command | |||
|- | |||
| Azimuth || High || <span style="font-family:courier">azimuthvelocity -5000 ant6</span> | |||
|- | |||
| || Low || <span style="font-family:courier">azimuthvelocity 5000 ant6</span> | |||
|- | |||
| Elevation || High || <span style="font-family:courier">elevationvelocity -5000 ant3</span> | |||
|- | |||
| || Low || <span style="font-family:courier">elevationvelocity 5000 ant6</span> | |||
|} | |||
Once the limit indicator goes green issue the command: | |||
<pre style="font-family:courier">azimuthvelocity 0 ant#</pre> | |||
or | |||
<pre style="font-family:courier">elevationvelocity 0 ant#</pre> | |||
Return the antenna to tracking: | |||
<pre style="font-family:courier">track ant#</pre> | |||
===== Antenna at its limits (Old Antennas) ===== | |||
Initially try to stow the antenna: | |||
<pre style="font-family:courier">stow ant#</pre> | |||
It may take a while for the antenna to stow. | |||
If the antenna fails to stow, it will need to be manually driven off its limit as described here: http://www.ovsa.njit.edu/wiki/index.php/Owen%27s_Notes#Moving_the_Old_Antennas_Manually and then try to stow the antenna. | |||
Once stowed, return the antenna to tracking: | |||
<pre style="font-family:courier">track ant#</pre> | |||
===== Bad values for antenna position ===== | |||
If any of the following is true: | |||
:on antennas 1 to 8 or 12 the azimuth is outside the range of 0 to 360 degrees, | |||
:on antennas 1 to 8 or 12 the elevation is outside the range of 0 to 90 degrees, | |||
:on antennas 9 to 11 or 13 the hour angle is outside the range of -180 to 180 degrees, | |||
:on antennas 9 to 11 or 13 the declination is outside the range of -90 to 90 degrees, | |||
you can try to issue the following commands: | |||
<pre style="font-family:courier"> | |||
stop ant# | |||
sync-motion ant# | |||
</pre> | |||
The antenna should then go to its stow position. Once it is stowed send the commands: | |||
<pre style="font-family:courier">tracktable sun_tab.radec ant# | |||
<pre style="font-family:courier">track ant# | |||
</pre> | |||
The antenna should resume tracking. | |||
===== Rebooting the antenna ===== | |||
On the newer antennas (antennas 1 to 8 and 12), access the window computer, click on then Quick launch icon at bottom right and then click on the antenna that is problematic. | |||
[[File:Ant_Selector.png]] | |||
A screen window to that below will come up. Ensure that the Enable box at the lower right is checked. | |||
[[File:Win_Ant_Controller.png]] | |||
One or both of the Permit boxes may be red. | |||
Click on the Reboot Drives button. and wait about 10 seconds. The click on the Drives On Button. It should turn Green. Click on the Operate Button. If this does not turn green you may need to reboot the edge13b server. | |||
Click Exit. | |||
===== Rebooting the antenna interface on the edge13b server ===== | |||
Whenever an antenna link seems to be down (indicated by the lack of a blinking link light on the edge13b router), note the port that is down (The antenna is labelled on each fibre pair). | |||
[[File:Edge13b_router.jpg]] | |||
Refer to it as | |||
<pre style="font-family:courier">fa0/#</pre> | |||
where # is the number of the port. E.g., if port 1 is down, it will be referred to as fa0/1. | |||
From Helios, telnet to the switch: | |||
<pre style="font-family:courier">telnet edge13b.admin.pvt</pre> | |||
Enter the the password when prompted. | |||
Enter the command: | |||
<pre style="font-family:courier">show inter fa0/1</pre> | |||
[[File:Edge13b_status.png]] | |||
The first line will show the status. If it is listed as Connected then nothing needs to be done. Enter: | |||
<pre style="font-family:courier">quit</pre> | |||
to exit from telnet | |||
If the connection is listed as err-disabled then proceed with the following steps. At the telnet terminal issue the commands: | |||
<pre style="font-family:courier">enable</pre> | |||
and enter the password. | |||
<pre style="font-family:courier"> | |||
configure ter | |||
interface fa0/# | |||
</pre> | |||
where # is the port number. | |||
<pre style="font-family:courier">shutdown | |||
no shutdown | |||
end | |||
</pre> | |||
You can then reissue the show inter command to see if the interface is running. The port light should also be blinking on the server. | |||
Issue then command | |||
<pre style="font-family:courier">quit</pre> | |||
to exit telnet. | |||
===== Resetting antenna parameters ===== | |||
If the antenna still will not start goto the following webpage: | |||
<pre style="font-family:courier">http://ant#.solar.pvt</pre> | |||
Click Login and then enter the username and password. | |||
Click Parameters and the change Option 10.00 to 1070 and Option 10.38 to 100. Click on change. | |||
Then click on logout. | |||
After the above procedures are completed you will need to reload the track table. This is done from the State Frame display using the following commands (again ensure that ant5 is replaced with the appropriate antenna): | |||
<pre style="font-family:courier"> | |||
tracktable pcal_tab.radec ant5 | |||
font-family:courier">track ant5 | |||
</pre> | |||
===== Antenna Communications Failure ===== | |||
If an antenna is highlighted in the Communications section of the State-Frame display then the following procedure can be used to correct it. | |||
From the Schedule on Helios enter the command | |||
<pre style="font-family:courier">$pcycle crio ant2</pre> | |||
and wait about 2 minutes. | |||
From the Schedule on Helios issue the command | |||
<pre style="font-family:courier">sync ant#</pre> | |||
for the newer antennas or | |||
<pre style="font-family:courier">sync-motion ant#</pre> | |||
for the older antennas where # is the antenna number. | |||
If this does not resolve the communications problem, then proceed with the procedure below. | |||
Access the win1 computer. | |||
Click on Start then select NI Max. | |||
[[File:Start-NIMAX.png]] | |||
Goto Remote Systems and then select the CRIO that is not communicating. | |||
[[File:NIMAX.png]] | |||
Click the System Settings tab at the bottom of the window. Status should be listed as <span style="font-family:courier">Connected - Running</span> | |||
[[File:NIMAX-settings.png]] | |||
Click on Refresh to reconnect. | |||
The CRIO will have an IP address in the range of 192.168.24.41 to 192.168.24.53. If it is not working this IP address will be strange. Click Restart. | |||
From the Schedule on Helios issue the command | |||
<pre style="font-family:courier">sync ant#</pre> | |||
where # is the antenna number. | |||
If the communications are still not restored, you will need open Labview. | |||
If it is not already open, Click Start then NI Labview 2015. | |||
[[File:Start-NI-Labview.png]] | |||
The LabView start screen will appear after a few seconds. | |||
[[File:NI-Labviewstrtscrn.png]] | |||
Click on the Operate menu option and then select Debug Application or Shared Library. | |||
[[File:LV-Op-debug.png]] | |||
Once the new window opens type in the name of the CRIO in the Machine Name or IP Address box. Then click Refresh. The file startup.rtexe should appear. Click on Connect. | |||
'''<span style="color:red">Note that if a message similar to 'No debuggable application found' is displayed you may need to click on refresh several times. When it first reboots it will say it cannot find any debuggable applications, and then at some point it comes back with startup.exe. But if you wait too long it ends up in software safe mode (it will display "Safe Mode" next to Running) and you will need to click on "Restart" in the NI-Max program and click refresh on the Labview program until you see startup.exe, wait for a few seconds and then hit the button to load the debug software.</span>''' | |||
[[File:LV-debugstart.png]] | |||
In the new window that opens check that the time is updating and that the time is correct an updating and that the Run index is updating. The Exec States should all be set to Run. | |||
[[File:Crio-debug.png]] | |||
At the top of the screen click on the Stop Icon and then the Go icon (the arrow). | |||
From the Schedule on Helios issue the command | |||
<pre style="font-family:courier">sync ant#</pre> | |||
or | |||
<pre style="font-family:courier">sync-motion ant#</pre> | |||
where # is the antenna number, depending on whether it is a new or old antenna. | |||
To exit from the Debug session, right click on an empty part of the form which will bring up Remote Debugging. Click on this and then select Quit Debug Session. | |||
[[File:LV-debug-close.png]] | |||
If the above procedure has not worked, then from the debug session, right click on an empty part of the window and then click on Remote Debugging and then Show Block Diagram. | |||
[[File:LV_show_block_diagram.png]] | |||
This will bring up the block diagram. Double click on the left bottom icon. | |||
[[File:LV_comm_icon.png]] | |||
This brings up the cRIO antenna VI. | |||
[[File:Crio_ant_vi.png]] | |||
Click on the stop button. It should restart in a few seconds automatically. Close the opened windows except for the Debug session (click on an empty part of the form then Remote Debuggingthen Quit Debug Session). | |||
If all else fails, restart the CRIO from the Viking unit. | |||
===== Restarting the Viking Unit ===== | |||
The Viking units control power to the various systems (Antenna, Front End and CRIO). To recycle power to a particular system, goto the webpage | |||
<pre style="font-family:courier">http://vik#.solar.pvt</pre> | |||
where # is the antenna number. Enter the username and password. The following screen should appear: | |||
[[File:Viking.png]] | |||
Note that when the relays are off, power is being supplied to the indicated system. In the image above, all relays are off so each system is powered. | |||
To recycle power to a particular system, click on the circle next to the system. If the circle was red initially, it will go green, and vice-versa. If you are turning the relay on then wait ten seconds before turning the relay off again. Ensure that the relay is Off (red) before logging out. | |||
===== Ant 12 Cable Wrap ===== | |||
From time to time, Ant 12 may get past its limits and get into the wrong "turn." If this happens, the cables can be unwrapped using the hand controller, but doing that does not reset the "turn" indicator (parameter 20.17). After manually unwrapping in this way, go to the antenna web page (or the Ant12_ACI interface on the win1 machine) and check the value of parameter 20.17. If it says 2, it means it is on the wrong turn (should be 1). In that case, attempting to STOW or TRACK the antenna will only make it try to unwrap and end up stuck at the north limit. If this happens, manually move the antenna back to the south point with the hand controller, and then check the value of parameter 20.17. If it is not now 1, you may have moved the antenna in the wrong direction. Once it is back to 1, check the parameter 20.15, which is the encoder zero. Add or subtract 360 degrees to that value and set the 20.15 parameter to the new value. For example, on 8/17/2021, the encoder zero was -29, so we set it to 331. Next time it happens, we would probably set the value back to -29. In any case, after changing the parameter, the dish should STOW properly. | |||
=== Receiver Trouble Shooting and Repair === | |||
==== Positioning the Antenna ==== | |||
If working on a newer antenna follow the instructions here: http://www.ovsa.njit.edu/wiki/index.php/Owen%27s_Notes#Moving_the_New_Antennas_Manually | |||
If working on an older antenna follow the instructions here: http://www.ovsa.njit.edu/wiki/index.php/Owen%27s_Notes#Moving_the_Old_Antennas_Manually | |||
==== Removing the Receiver ==== | |||
Switch off the power to the receiver at the auxiliary box by pulling down the two breakers. | |||
[[File:auxboxbreakers.jpg]] | |||
Below is an image of the tools required for removing the receiver. | |||
[[File:rectools.png]] | |||
'''Whenever touching the receiver ensure that the Anti-static strap is worn and grounded!''' | |||
Loosen the nuts on bolts that attach the receiver to the feed almost the entire way but leave them on the bolts. The feed can be pressed forward to give enough room to detach the SMA cables. | |||
[[File:recbolts.png]] | |||
Carefully disconnect the SMA cables from the feed. Note the position of the horizontal and vertical polarisation cables. | |||
[[File:smacablesfeed.png]] | |||
Place caps on the end of the SMA cables. | |||
[[File:smacablescapped.png]] | |||
Carefully remove all of the cables from the back of the receiver. | |||
[[File:Reccables.png]] | |||
Place a cap on the fibre optic port and the fibre optic cable. | |||
[[File:Fibrecablecapped.png]] [[File:Fibreportcapped.png]] | |||
Remove the nuts entirely. | |||
Remove the 3 allen bolts. | |||
[[File:recallenbolts.png]] | |||
The receiver can now be taken into the lab for testing or repair. | |||
==== Opening the Receiver ==== | |||
'''Ensure you are grounded with the anti-static strap!''' | |||
Remove removing the bolts from the stoppers, but keep the stoppers in place. Once removed the triangular front mounting bracket will slide off. | |||
[[File:recstoppers.png]] | |||
Recessed into the case are 6 screws that need to be undone. the location of 4 of these are shown in the image below. Loosen the screws using a Phillips head screwdriver. The will no come all the way out. | |||
[[File:reccasescrews.png]] | |||
Place the receiver on it side and cautiously partially open the case. The SMA cable connecting the two halves together needs to be disconnected before the case can be fully opened. Carefully loosen the SMA cable on the Horizontal polarisation side and disconnect the cable. | |||
[[File:Recinternalsmacable.png]] | |||
Cautiously fully open the case. | |||
There is a full replica of the Auxiliary box under the bench. If testing is to be performed then this will need to be connected. Note that the CRIO out at the antenna will also need to be powered on. Ensuring that the power is off, connect the cables to the receiver. | |||
'''Whenever disconnecting or connecting components to the receiver, ensure that the power is off!''' | |||
[[File:Auxrep.png]] [[File:Cablesconnected.png]] | |||
Reconnect the SMA cable between the two halves of the receivers. | |||
==== Connecting the Power Meter ==== | |||
If required for testing, the power meter will need to be connected to the either the horizontal or vertical polarisation. The power meter is normally kept in the correlator room. | |||
[[File:Powermeter.jpg]] | |||
Connect the power meter to the appropriate polarisation as shown below. | |||
[[File:Powermeterconnected.jpg]] | |||
==== Replacing the LNA ==== | |||
Ensure that power is off to the receiver. | |||
The LNA locations is shown below. It is in the same place on the other half of the receiver for the other polarisation. | |||
[[File:LNAinrec.jpg]] | |||
Carefully unsolder the black and red wires connected to the LNA. | |||
Undo the nuts on either side of the LNA. To undo they will move towards the LNA. | |||
Remove the allen bolts fixing the LNA to the case. | |||
Carefully remove the LNA. | |||
Add some silicone heat sink compound to the base of the new LNA. | |||
Repeat the process in reverse to install the new LNA. | |||
=== Brightscram Adjustment === | |||
Occasionally, the brightscram sensors will need to be tested or adjusted. A clear day with full sun is required for this adjustment. Antennas 1 to 8 have a bright scram sensor. | |||
There are two major components to the brightscram sensor: The buffer board and the sensor. The sensor is located on the antenna feed as shown in the image below. | |||
[[File: Brightscram sensor.jpg]] | |||
The sensor needs to be aligned with the point of the feed. | |||
The buffer board is located in the auxiliary box as shown below. | |||
[[File: BufferBoard.jpg]] | |||
Refer to the annotated image below and follow the procedure below to adjust the brightscram settings. | |||
[[File: Buf board bscram.jpg]] | |||
:With the antenna pointing at the Sun, measure the voltage between V<sub>sense</sub> and Ground. | |||
:Measure the voltage between V<sub>trig</sub> (Pin 2 on the U8 chip) and ground. | |||
:Adjust this voltage by turning the screw on Trig Adj (labelled VR3 on the board). The Voltage here should be about 0.05 V '''BELOW''' that of V<sub>Sense</sub>. | |||
:Once done, using the spray container, wet the dish. The dish should move off the sun and return 10 minutes later. If it does not, you will need to adjust V<sub>trig</sub> until it does. | |||
=== UPS Battery Replacement === | |||
Periodically, the batteries on the Uninterruptable Power Supplies (UPS) will need replacing. There are 4 in total: one in each of the four central racks and one in the network rack. The LCD at the front of the UPS will display a message when the batteries need to be replaced as shown below. | |||
[[File:UPS_Batt_Warning.jpg]] | |||
Below is an annotated image of the UPS front panel showing the important components. | |||
[[File:UPS_Front_Panel.jpg]] | |||
To remove the battery pack, follow the instructions below. | |||
:Undo the three screws on the front chasis. | |||
:Disconnect the blue battery connector. | |||
:Lift the battery back and pull out. '''Be careful! It is heavy!.''' | |||
:See the image below of the removed battery pack. | |||
[[File:BattPack_removed.jpg]] | |||
:Remove the top cover by undoing the screws at either end of the tray. The image below shows the batteries within the tray. | |||
[[File:UPS-Batteries.jpg]] | |||
=== Resetting the ManLight === | |||
Detach the serial cable from the ACC and connect to a serial to USB adapter. Connect this to the laptop. | |||
Check the serial ports in Device manager to obtain the com port number. | |||
Click on Start -> PRD Serial -> main.exe. | |||
Select Setup and change COM1 to the appropriate port. | |||
In the Enables tab disable IP, IT and ITF monitor ports. | |||
Start the program running by clicking on the arrow in the upper left. | |||
In the Control tabs set the following: | |||
:'ACC mode pump current 1' to 250 and press the LOAD button. | |||
:'AM - EDFA Mode' to ACC - constant current and press the load button. | |||
:'LO - loss Output Power Alarm threshold' to 20 and press the load button. | |||
If any load button does not underpress, the GUI is hung up and rebooting the computer may be necessary. In that case you can start where you left off. | |||
== Antenna A Power Outage and Reset == | |||
=== Recycling Power to Antenna A === | |||
To recycle power to Antenna A goto http://pduanta.solar.pvt and enter the username and password. | |||
There will be eight devices that can be chosen from. Click <span style="font-family:courier">Cycle</span> to recycle the power to the appropriate option. | |||
You may need to follow the procedure below to bring Antenna A back to operation. | |||
=== Recovering Antenna A from a Power Outage === | |||
On the Stateframe display click on the CryoRX tab. This will bring up the display shown below. | |||
[[File:CryoRXdisp.png]] | |||
==== Recycling Power to the FEM ==== | |||
Login to the feanta machine as follows: | |||
<pre style="font-family:courier">ssh antctl@feanta</pre> | |||
If the FEM Outlets on the CryoRX window are marked as Off then from a Helios terminal: | |||
Then type in the command: | |||
<pre style="font-family:courier">/home/antctl/starburst/femTools/src/starburstControl start</pre> | |||
Otherwise recycle the power to the FEM as follows: | |||
<pre style="font-family:courier">/home/antctl/starburst/femTools/src/starburstControl stop</pre> | |||
Wait about 10 seconds and the issue the start command: | |||
<pre style="font-family:courier">/home/antctl/starburst/femTools/src/starburstControl start</pre> | |||
Once done type in: | |||
<pre style="font-family:courier">exit</pre> | |||
==== Recycling Power to the Brick ==== | |||
If faults are showing on the Motor section (4th green line down) the Brick power will need to be recycled. To do this issue the following commands from the Schedule Window: | |||
<pre style="font-family:courier"> | |||
outlet 3 off ant14 | |||
outlet 3 on ant14 | |||
</pre> | |||
==== Restarting the LNAs ==== | |||
From a Helios terminal: | |||
<pre style="font-family:courier">ssh root@lna14.solar.pvt</pre> | |||
If you get an error "No route to host" you will need to restart the computer at the 27m antenna by issuing the commands below from the Schedule Window: | |||
<pre style="font-family:courier"> | |||
outlet 6 off ant14 | |||
outlet 6 on ant14 | |||
</pre> | |||
Then issue the command from the terminal: | |||
<pre style="font-family:courier">./killAll python</pre> | |||
Then press the up arrow until the most recent python command is found and press enter. Text will scroll up continuously | |||
Just type <span style="font-family:courier">exit</span> even with the text scrolling to exit the ssh session. | |||
From Schedule issue the command: | |||
<pre style="font-family:courier">$lna-init ant14</pre> | |||
The Drain Voltage for Hi H will be incorrect (~.61 when it should be 1.2). To correct this, from Schedule issue: | |||
<pre style="font-family:courier">lna drain hh 2.4 ant14</pre> | |||
==== Aligning the Receivers ==== | |||
'''<span style="color:#FF0000">Only do this once Mark Hodges has confirmed that he does NOT have the external vacuum pump connected!</span>''' | |||
The receivers must be properly aligned. From Schedule send the command: | |||
<pre style="font-family:courier">frm-home ant14</pre> | |||
If the receivers do not home properly, you will need to cycle power on the brick: http://ovsa.njit.edu//wiki/index.php/Owen%27s_Notes#Recycling_Power_to_the_Brick | |||
It will take a few minutes for the FRM to find its home position. Once it has send the command: | |||
<pre style="font-family:courier">frm-set-pa 0 ant14</pre> | |||
to zero the positions. | |||
Set the Hi Receiver: | |||
<pre style="font-family:courier">rx-select hi ant14</pre> | |||
==== Ant A Maths Error ==== | |||
Goto the webpage <span style="font-family:courier">https://ant14.solar.pvt</span>. You should get to the screen as shown below: | |||
[[File:AntA-Web-Home.png]] | |||
Ensure that on the left under the SP image that there is a green 'Ready' message. | |||
If there is a Maths Error then follow the following procedure. | |||
Click on the Login tab and enter the username and password. | |||
Click on the Parameter tab to see the following screen: | |||
[[File:AntA-Web-Param-Opt10-marked.png]] | |||
Click on view next to #10. | |||
At the next screen click on view next to Item #10.00: | |||
[[File:AntA-Web_Opt10.00-marked.png]] | |||
In the Update Value box enter 1070 and click on Change | |||
Click on the arrow near the top of the page to return to menu 10. | |||
Click on View next to Item #10.38 | |||
In the Update Value box enter 100 and click on Change. | |||
=== Preventing the Receiver from Moving During Maintenance === | |||
During some types of maintenance, the receiver should not be moved. To prevent this from happening, log into feanta: | |||
:<p style="font-family:courier">ssh antctl@feanta</p> | |||
and then issue the command: | |||
:<p style="font-family:courier">/home/antctl/starburst/femTools/src/starburstControl stop</p> | |||
Type <span style="font-family:courier">exit<span> to end the feanta session. | |||
To reactivate, log back into feanta and send the command: | |||
:<p style="font-family:courier">/home/antctl/starburst/femTools/src/starburstControl start</p> | |||
Note that this resets every evening. If a shutdown is required for longer than that then feanta may need to be shutdown. | |||
== Site Wide Power Outage == | |||
Most of the procedures to recover from a site wide power outage are covered above. Below are the the steps required in order. | |||
=== 27m Antenna (Antenna A) === | |||
Refer to the procedure here: http://www.ovsa.njit.edu/wiki/index.php/Owen%27s_Notes#Recovering_Antenna_A_from_a_Power_Outage | |||
=== 2m Antennas (Antennas 1-13) === | |||
For any antennas that have a communications failure (highlighted in red in the communications section of the Stateframe Display) follow the procedures here: http://www.ovsa.njit.edu/wiki/index.php/Owen%27s_Notes#Antenna_Communications_Failure | |||
It may take some time for the CRIOs to restart. If after 20 minutes a CRIO has not restarted, redo the procedure. | |||
Stop the schedule by clicking on the stop button. | |||
Stow the antennas by issuing the command | |||
<pre style="font-family:courier">stow</pre> | |||
If some of the antennas did not stow the refer to Antenna trouble shooting: http://www.ovsa.njit.edu/wiki/index.php/Owen%27s_Notes#Antenna_Trouble_Shooting | |||
If an antenna is highlighted in the Power and Attenuation section on the stateframe display then you may need to reload the .ini file to the CRIO as described here: http://www.ovsa.njit.edu/wiki/index.php/Owen%27s_Notes#Warning_on_Power_and_Attenuation | |||
== Data Backup == | |||
=== Local IDB File Backup === | |||
Periodically IDB files will need to be moved from pipeline. Currently these are being stored on NAS4. Typically a year of data will be copied. Follow the procedure below (replace nas4 with the appropriate drive): | |||
:Login to pipeline. an then issue the command: | |||
<pre style="font-family:courier">screen -S filecopy</pre> | |||
:Enter the command; | |||
<pre style="font-family:courier">cp -r -v /data1/eovsa/fits/IDB/yyyy* /nas4/IDB/</pre> | |||
:where yyyy is the year of the files to copy. | |||
:Press <CRTL>AD to exit the screen | |||
=== Caltech IDB File Backup === | |||
IDB files are copied onto two USB drives and mailed to Caltech. The drives hold approximately three months of IDB data. Use the following procedure to copy the files. | |||
:Connect the USB drives to your local computer. Make a note of the last file on the disk. Delete all of the IDB, FDB and IFDB files from the drives. | |||
:Connect the drive to the USB port at the back of the pipeline machine. | |||
:Login to the user account on pipeline. | |||
:List the available drives by typing the command: | |||
<pre style="font-family:courier">sudo fdisk -l</pre> | |||
:A list of drives will appear. Find the line similar to the one below: | |||
<pre style="font-family:courier">/dev/sdc1 2048 7813969919 7813967872 3.7T Microsoft basic data</pre> | |||
:Note that the device might be different to /dev/sdc1, but it will be the 3.7T drive. In the rest of these instructions assumes that the device is /dev/sdc1. Replace this with whatever is the appropriate device. | |||
:Mount the USB drive: | |||
<pre style="font-family:courier">sudo mount /dev/sdc1 /media/IDB-backup1</pre> | |||
:Open the IDB backup script using nano: | |||
<pre style="font-family:courier">nano owen/archiveIDB.sh</pre> | |||
:Find the two lines similar to: | |||
<pre style="font-family:courier"> | |||
start=$(date -d "2020-09-13" +%Y%m%d) | |||
end=$(date -d "2020-12-31" +%Y%m%d) | |||
</pre> | |||
:Change the start date to the day after the last date of the previous data copy and the end date to 3 months further on. | |||
:Press [CTRL][X] and the Y to exit and save the file. | |||
:If a screen named filecopy does not exist then issue the following command: | |||
<pre style="font-family:courier">screen -S filecopy</pre> | |||
:If the screen does exist then | |||
<pre style="font-family:courier">screen -r filecopy</pre> | |||
:To start the filecopy issue the following commands: | |||
<pre style="font-family:courier">cd ~/owen | |||
./archiveIDB.sh | |||
</pre> | |||
:You can then press [CTRL][a][d] to exit the screen. | |||
Once the copy has been completed, unmount the drive: | |||
<pre style="font-family:courier">sudo umount /media/IDB-backup1</pre> | |||
Repeat the process for the second drive. | |||
=== Common Files === | |||
The common folder on Helios is backed up automatically on Sundays at midnight. This backup is stored on the nas2 drive. To manually back up the folder, issue the following commands from a helios terminal: | |||
<pre style="font-family:courier">screen -S commoncopy</pre> | |||
:Enter the command: | |||
<pre style="font-family:courier">rsync -av --delete --progress --log-file=/home/sched/rsynclogs/rsync_common.log -e ssh /common/ user@pipeline:/nas2/common/</pre> | |||
:Press <CRTL>AD to exit the screen | |||
Output from rsync is logged in <span style="font-family:courier">/home/sched/rsynclogs/rsync_common.log<span> | |||
=== Crontab Backups === | |||
The crontab files are backed up on nas2 in the crontabs folder. | |||
The helios crontab is stored in <span style="font-family:courier">helios_cron</span> | |||
The pipeline crontab is stored in <span style="font-family:courier">pipeline_cron</span> | |||
The dpp crontab is stored in <span style="font-family:courier">dpp_cron</span> | |||
== Location of IDB and Associated Files == | |||
{|class="wikitable" style="text-align: center;" | |||
|+ style="caption-side:top;"|''IDB File Locations'' | |||
!Date Range||Location | |||
|- | |||
|2014 to 2015||nas3/IDB2014-15 | |||
|- | |||
|2016-01-01 to 2016-07-31||nas1 | |||
|- | |||
|2016-08-01 to 2016-11-30||nas2 | |||
|- | |||
|2016-12-01 to 2021-02-28||nas3/IDB | |||
|- | |||
|2021-03-01 to 2021-12-31||nas4/IDB | |||
|- | |||
|} | |||
{|class="wikitable" style="text-align: center;" | |||
|+ style="caption-side:top;"|''FDB File Locations'' | |||
!Date Range||Location | |||
|- | |||
|2013-12-19 to 2015012031||nas3/FDB2014-15 | |||
|- | |||
|2016-01-01 to 2016-07-31||nas1/FDB | |||
|- | |||
|2016-08-01 to 2016-11-30||nas2/FDB | |||
|- | |||
|2016-12-01 to 2021-02-28||nas3/FDB | |||
|- | |||
|2021-03-01 to 2021-12-31||nas4/FDB | |||
|- | |||
|} | |||
{|class="wikitable" style="text-align: center;" | |||
|+ style="caption-side:top;"|''IFDB File Locations'' | |||
!Date Range||Location | |||
|- | |||
|2014-01-24 to 2015012031||nas3/IFDB2014-15 | |||
|- | |||
|2016-01-01 to 2016-07-31||nas1/IFDB | |||
|- | |||
|2016-08-01 to 2016-11-30||nas2/IFDB | |||
|- | |||
|2016-12-01 to 2021-02-28||nas3/IFDB | |||
|- | |||
|2021-03-01 to 2021-12-31||nas4/IFDB | |||
|- | |||
|} | |||
== Schedule Command Description == | |||
NOTE: All Schedule commands accept as optional arguments a list of antennas to which the command should selectively sent. Accepted syntaxes are: | |||
Command ant1 ant2 ant3 | |||
Command ant1-3 | |||
Command subarray1 | |||
Command subarray2 | |||
If no antenna list is indicated, the command is sent to all antennas currently in subarray1. | |||
These commands can be found in the <span style="font-family:courier">~/Dropbox/EOVSA\ M\&C/EOVSA\ Schedule\ Commands.docx</span> and <span style="font-family:courier">~/Dropbox/OVSA\ Expansion/Design/Antennas/Ant_A\&B_Commands.pdf</span> files. | |||
=== Commands handled directly by ACC === | |||
<p style="color:#0000FF">'''ABORT'''</p> | |||
:Aborts all commands sent to ACC but not yet executed | |||
<p style="color:#0000FF">'''CLEAROFF [antenna list]'''</p> | |||
:Sets all AzEl or RaDec offsets to zero | |||
<p style="color:#0000FF">'''DCMATTN HPOLattn VPOLattn [antenna list]'''</p> | |||
:Indicates the VPOL and HPOL attenuations for the DCM modules indicated in the list. The attenuations are applied on the next second start. | |||
:<p style="color:#FF0000">'''Warning: The command is executed only if the DCM modules are in manual mode (see the DCMAUTO-ON and DCMAUTO-OFF command below)'''</p> | |||
<p style="color:#0000FF">'''DCMAUTO-OFF [antenna list]'''</p> | |||
:Sets the DCM modules in the manual attenuation mode. This mode allows the attenuations requested by the DCMATTN to be applied. | |||
<p style="color:#0000FF">'''DCMAUTO-ON [antenna list]'''</p> | |||
:Sets the DCM modules in the automatic attenuation mode. This mode ignores the manual DCMATTN commands and applies the attenuation set through the DCMOFFSET mechanism. | |||
<p style="color:#0000FF">'''DCMOFFSET inc1 inc2…..inc50'''</p> | |||
:Sets the 50 DCM attenuation offset increments to be added to the current list of DCM offset attenuations to be cycled during each second, starting with the next second boundary. The command expects up to 50 arguments. If fewer arguments are provided, the existing set is repeated in the same sequence until all 50 slots are filled. This command is only intended for testing. During normal operations, the DCM offsets states are requested by the DPP computer when needed. | |||
:<p style="color:#FF0000">'''Warning: The command is executed only if the DCM modules are in auto mode (see the DCMAUTO-ON and DCMAUTO-OFF command below).'''</p> | |||
:'''NOTE: The DCM offsets are changed on the edge of the next second after a TCP/IP message is received by ACC at the TCP.dpp.port (default port: 6344-set in ACC.ini file ). The message is expected to be a fixed length binary string having the following format: 50 32bit integers (I32)''' | |||
<p style="color:#0000FF">'''DCMOFFSET-CLEAR'''</p> | |||
:Clears the current list of 50 DCM offset attenuations that are applied when DCMAUTO-ON is set. | |||
:<p style="color:#FF0000">'''Warning: This command clears the offset attenuations for all DCM modules.'''</p> | |||
<p style="color:#0000FF">'''DCMTABLE [antennalist] filename'''</p> | |||
:Request the antenna list portion of a specific DCM base attenuation table to be uploaded on the respective DCM modules. The DCM table must have 30 columns and 50 rows, each pair of adjacent columns listing the HPOL-VPOL pairs for each of the 50 slots of a tuning sequence. The DCM table text file must be located in the ACC “c:\parm” directory and its default name is “DCM.txt”. | |||
:The DCM/table_timeout key in the ACC.ini files have to be manually edited in order to modify the default timeout (ms) of the DCM modules when a table is broadcasted. | |||
:The actual DCM attenuations for a given tuning slot are calculated based on the following formula | |||
::<p style="color:#00FF00">DCM_atten[pol,tuning_index]=DCM_base_atten[pol,tuning_index]+DCM_offset[broadcasted]</p> | |||
<p style="color:#0000FF">'''DPPOFFSET-OFF'''</p> | |||
:Ignores DCM offset attenuation recommendations sent by DPP but still allows setting the offsets via the DCMOFFSET schedule command. | |||
<p style="color:#0000FF">'''DPPOFFSET-ON'''</p> | |||
:Applies DCM offset attenuation recommendations sent by DPP but still allows setting the offsets via the DCMOFFSET schedule command. | |||
:'''NOTE: This is the default behavior of the system after each hardware ACC reboot or after a REBOOT or RESET command is sent via TCP/IP to the emergency 6543 acc.solar.ini port''' | |||
<p style="color:#0000FF">'''FEM-INIT</p> | |||
:Initialize all front-end module base attenuations with the values read from the ACC initialization file: “c:\ni-rt\startup\acc.ini”. | |||
<p style="color:#0000FF">'''FEMATTN level [antennalist]'''</p> | |||
:Manually selects the front-end attenuation levels for the antennas indicated in the list to be applied on the next second boundary. The attenuation level selects the corresponding entry in the “c:\parms\FEMATTN.txt” attenuation FEM table located on each the cRIOs. | |||
:The attenuation level set by this command is saved in the [FEM AGC] section of the “c:\ni-rt\startup\crio.ini” and it is automatically applied when the module is restarted. | |||
:<p style="color:#FF0000">'''Warning: The attenuation level setting may be overwritten by the AGC loop, if active.'''</p> | |||
:The format of the table is as shown below (column heads are added here for clarity) | |||
{| class="wikitable" style="text-align: center; margin: auto;" | |||
|- | |||
! FEMATTN level !! First attenuation !! Second attenuation !! Total attenuation | |||
|- | |||
| 0 || 0 || 0 || 0 | |||
|- | |||
| 1 || 0 || 3 || 3 | |||
|- | |||
| 2 || 0 || 6 || 6 | |||
|- | |||
| 3 || 0 || 9 || 9 | |||
|- | |||
| 4 || 0 || 12 || 12 | |||
|- | |||
| 5 || 0 || 15 || 15 | |||
|- | |||
| 6 || 0 || 18 || 18 | |||
|- | |||
| 7 || 9 || 12 || 21 | |||
|- | |||
| 8 || 9 || 15 || 24 | |||
|- | |||
| 9 || 9 || 18 || 27 | |||
|- | |||
| 10 || 9 || 21 || 30 | |||
|- | |||
| 11 || 9 || 24 || 33 | |||
|- | |||
| 12 || 9 || 27 || 36 | |||
|- | |||
| 13 || 18 || 21 || 39 | |||
|- | |||
| 14 || 18 || 24 || 42 | |||
|- | |||
| 15 || 31 || 31 || 62 | |||
|} | |||
:The actual FEM attenuations applied as the result of a FEMATTN command are given by | |||
::HPOL_ATTENUATION=HPOL_BASE+FEMATTN.txt(level) | |||
::VPOL_ATTENUATION=VPOL_BASE+FEMTTTN.txt(level) | |||
:Where Attenuation, Base, and FEMATTN.txt(level) are two elements vectors indicating the settings for the First and Second attenuators. | |||
<p style="color:#0000FF">'''HATTN first second [antennalist]'''</p> | |||
:Sets the FEM HPOL_BASE first and second attenuators for the antennas in the list, and overwrites the corresponding sections in the global “c:\ni-rt\startup\acc.ini” file, as well as in the local “c:\ni-rt\startup\crio.ini” files. | |||
<p style="color:#0000FF">'''VATTN first second [antennalist]'''</p> | |||
:Sets the FEM VPOL_BASE first and second attenuators for the antennas in the list, and overwrites the corresponding sections in the global “c:\ni-rt\startup\acc.ini” file, as well as in the local “c:\ni-rt\startup\crio.ini” files. | |||
<p style="color:#0000FF">'''FSEQ-FILE filename'''</p> | |||
:Tells ACC to upload to the Hittite synthesizer the frequency sequence located at “c:\parm\filename”. | |||
<p style="color:#0000FF">'''FSEQ-INIT'''</p> | |||
:Initializes the Hittite synthesizer according to the settings defined in the [LO Configuration] section of the “c:\ni-rt\startup\acc.ini” file. | |||
<p style="color:#0000FF">'''FSEQ-ON'''</p> | |||
:Starts the tuning sequence | |||
<p style="color:#0000FF">'''FSEQ-OFF'''</p> | |||
:Stops the tuning sequence | |||
<p style="color:#0000FF">'''FSEQ-SCRIPT filename'''</p> | |||
:Sends, line by line, to the Hittite synthesizer the command sequence listed in the “c:\parm\filename” script file. | |||
<p style="color:#0000FF">'''LO1A-REBOOT'''</p> | |||
:Commands the PDU controller to recycle the power on the LO1A Hittite synthesizer | |||
<p style="color:#0000FF">'''LO1B-REBOOT'''</p> | |||
:Not implemented yet | |||
<p style="color:#0000FF">'''LO1A-WRITE command'''</p> | |||
:Sends the specified command to the LO1A Hittite synthesizer | |||
<p style="color:#0000FF">'''LO1B-WRITE command'''</p> | |||
:Sends the specified command to the LO1B Hittite synthesizer | |||
<p style="color:#0000FF">'''SERVICE [antennalist]'''</p> | |||
:Takes the antennas in the list out of subarray1 or subarray2 and drives them to the service position. | |||
:<p style="color:#FF0000">'''Warning: Once in service position, the serviced antenna should be put in local operation mode in order to avoid it being controlled by a subsequent schedule command.'''</p> | |||
<p style="color:#0000FF">'''SUBARRAY1 antennalist'''</p> | |||
:Puts all antennas in the list into subarray1. All antennas than are not listed, but currently in subarray1, are taken out from subarray1. | |||
:'''NOTE: As of Dec 03 2015, this command no longer switches by default the LO connector to an alternative source. To force the LO connector to switch switches, one must use the new explicit command SUBARRAY1_SWITCH antennalist''' | |||
<p style="color:#0000FF">'''SUBARRAY2 antennalist'''</p> | |||
:Puts all antennas in the list, which are not already in subarray1, into subarray2. In order to move a given antenna from subarray1 to subarray2, one should first redefine subarray1. | |||
:'''NOTE: As of Dec 03 2015, this command no longer switches by default the LO connector to an alternative source. To force the LO connector to switch switches, one must use the new explicit command SUBARRAY2_SWITCH antennalist''' | |||
<p style="color:#0000FF">'''SYNC [antennalist]'''</p> | |||
:Restarts the real-time executable on all cRIOs corresponding to the antenna list. | |||
:'''NOTE: Unlike the general convention, not providing a list of antennas commands all cRIOs to restarts their execution.''' | |||
<p style="color:#0000FF">'''TRACKTABLE filename [antennalist]'''</p> | |||
:Uploads to all antennas in the list the tracking table located at “c:\parm\filename” | |||
<p style="color:#0000FF">'''TRAJ-FILE filename [antennalist]'''</p> | |||
:Uploads to all cRIOs corresponding to antennas in the list the trajectory file table located at “c:\parm\filename” | |||
<p style="color:#0000FF">'''UNLISTEDCOMMAND [antennalist]'''</p> | |||
:Any command not listed above is sent for local execution to all cRIOs corresponding to antennas in the list. | |||
=== Commands handled by cRIOs === | |||
'''NOTE: These commands are selectively sent by ACC to all antennas in the optional argument antennalist, or, if not present, to all antennas in subarray1''' | |||
<p style="color:#0000FF">'''AGC active [low [high [samples]]]'''</p> | |||
:Activates (1) or deactivates (0) the front end automatic gain control loop, which adjust the FEMATTN level when both of the HPOL and VPOL voltages, averaged over the given number of consecutive samples , cross the low and high voltage limits. Missing parameter values are uploaded from the [FEM AGC] section of the local “c:\ni-rt\startup\crio.ini” file. All parameters provided when an AGC command is issued are saved in the same file for further use. | |||
:'''NOTE: At startup, the AGC loop is activated or not according with the latest active value written in the initialization file.''' | |||
<p style="color:#0000FF">'''AZELOFF azoff eloff'''</p> | |||
:Sets the Azimuth and Elevation offsets indicated in the argument list | |||
<p style="color:#0000FF">'''RADECOFF raoff decoff'''</p> | |||
:Sets the RA and DEC offsets indicated in the argument list | |||
<p style="color:#0000FF">'''FLUSH'''</p> | |||
:Flush the existing tracktable from the associated antenna controller | |||
<p style="color:#0000FF">'''ND-ON and ND-OFF'''</p> | |||
:Set on/off the local noise diode. | |||
<p style="color:#0000FF">'''POSITION azimuth elevation'''</p> | |||
:Requests a given azel position | |||
<p style="color:#0000FF">'''RESTART'''</p> | |||
:Reboots the cRIO | |||
<p style="color:#0000FF">'''DRIVE-RESET'''</p> | |||
:Resets Antenna controller | |||
<p style="color:#0000FF">'''STOP'''</p> | |||
:Stops the antenna | |||
<p style="color:#0000FF">'''STOW'''</p> | |||
:Stows the antenna | |||
<p style="color:#0000FF">'''TRACK'''</p> | |||
:Sets antenna in track mode | |||
<p style="color:#0000FF">'''TEC-LOG'''</p> | |||
:Dumps all TEC register values to the local log file “c:\tec.txt” for debugging purposes | |||
<p style="color:#0000FF">'''TEC-INIT'''</p> | |||
:Initializes the TEC controller with register values hard-coded in the crio code. These were read from a working controller at some time in the past. | |||
<p style="color:#0000FF">'''TEC$BC'''</p> | |||
:Reboot the TEC controller to recover from a bad or stuck state. | |||
<p style="color:#0000FF">'''TEC$SC'''</p> | |||
:Clear the error status of the TEC controller. Does nothing other than this, and is purely asthetic. | |||
<p style="color:#0000FF">'''TRAJ-ON and TRAJ-OFF'''</p> | |||
:Starts/Ends the execution of the trajectory script | |||
:'''NOTE: At startup, the WINDSCRAM loop is activated or not according with the latest active written in the initialization file.''' | |||
<p style="color:#0000FF">'''BSCRAM-ON</p> | |||
:Activate the BRIGHTSCRAM Monitor | |||
<p style="color:#0000FF">'''BSCRAM-OFF'''</p> | |||
:Deactivate the BRIGHTSCRAM Monitor | |||
<p style="color:#0000FF">'''BSCRAM-CLEAR'''</p> | |||
:Takes the antenna out of the BRIGHTSCRAM Active State independently of the brightness sensor state. | |||
:If the BRIGHTSCRAM Monitor’s operation mode is set to STOW, clearing the BRIGHSCRAM ACTIVE state does not have any effect on the mechanical state of the antenna. If the BRIGHTSCRAM Monitor’s operation mode is set to OFFSET, clearing the BRIGHSCRAM ACTIVE state results in removing the AZEL offsets | |||
:'''Note: If the BRIGHTSCRAM Monitor is active, the antenna may get back in the Active State depending on the state of the brightness sensor.''' | |||
<p style="color:#0000FF">'''BSCRAM-SET'''</p> | |||
:Force the antenna into the BRIGHTSCRAM Active State independently of the brightness sensor state. | |||
<p style="color:#0000FF">'''BSCRAM-WAIT seconds'''</p> | |||
:Sets the BRIGHTSCRAM Monitor waiting time before clearing the BRIGHSCRAM ACTIVE state. | |||
:'''Note: This setting is saved in the crio.ini file and remains persistent until changed''' | |||
<p style="color:#0000FF">'''BSCRAM-OFFSET'''</p> | |||
:Sets the BRIGHTSCRAM operation mode to stow the antenna when in active state. | |||
:'''Note: This setting is saved in the crio.ini file and remains persistent until changed''' | |||
<p style="color:#0000FF">'''BSCRAM-OFFSET'''</p> | |||
:Sets the BRIGHTSCRAM operation mode to apply offsets | |||
:'''Note: This setting is saved in the crio.ini file and remains persistent until changed''' | |||
<p style="color:#0000FF">'''BSCRAM-AZELOFF azoff eloff</p> | |||
:Sets the Azimuth and Elevation Offsets (degrees) for the BRIGHTSCRAM offset operation mode. | |||
:'''Note: This setting is saved in the crio.ini file and remains persistent until changed. Default values re AZOFF=0 and ELOFF=10''' | |||
:<p style="color:#FF0000">'''Warning: No action is taken if less than 2 arguments are provided'''</p> | |||
<p style="color:#0000FF">'''WSCRAM-ON'''</p> | |||
:Activate the WINDSCRAM Monitor | |||
<p style="color:#0000FF">'''WSCRAM-OFF'''</p> | |||
:Deactivate the WINDSCRAM Monitor | |||
<p style="color:#0000FF">'''WSCRAM-LIMIT value'''</p> | |||
:Sets the wind speed threshold. | |||
:'''Note: This setting is saved in the crio.ini file and remains persistent across reboots until changed.''' | |||
<p style="color:#0000FF">'''WSCRAM-WAIT seconds'''</p> | |||
:Sets the WINDSCRAM Monitor waiting time between checking the wind speed. | |||
:'''Note: This setting is saved in the crio.ini file and remains persistent across reboots until changed.''' | |||
<p style="color:#0000FF">'''UpdateElevationDiagnostics 1'''</p> | |||
:Requests an update of the elevation trip register. | |||
<p style="color:#0000FF">'''UpdateAzimuthDiagnostics 1'''</p> | |||
:Requests an update of the azimuth trip register. | |||
<p style="color:#0000FF">'''REGWRITE address value'''</p> | |||
:Writes to a specific (new type) antenna register address the specified value. This command is ignored by the old type antennas. | |||
:For example, | |||
::REGWRITE 23386 2 [antlist] | |||
:may be used to set the controller in velocity mode. Note that the velocity rate registers must also be set to control the velocity of motion. The appropriate registers are: | |||
::AzimuthVelocity, or 23585 | |||
::ElevationVelocity, or 23605 | |||
:Alternatively, one can write to a specific register address by directly sending a command formed by the name of the register (as defined in the M&C document Controller_registers.xlsx) followed the desired value to be written. | |||
:For example one may alternatively set the controller in velocity mode by issuing the command | |||
::RUNMODE 2 [antlist] | |||
:A possible need for velocity mode is to drive an antenna off a hard limit. For safety, the only way to do that is to set the controller in velocity mode and provide a velocity in the direction to drive off the limit. For example, if Ant 6 is on an azimuth low hard limit, one can drive it off by the following sequence: | |||
::RUNMODE 2 ANT6 | |||
::AZIMUTHVELOCITY 5000 ANT6 | |||
:Wait for hard limit to clear. | |||
::AZIMUTHVELOCITY 0 ANT6 | |||
:TRACK ANT6 | |||
=== Antenna A (Antenna 14) Commands === | |||
'''Note: Only antenna A is currently in use. In the commands below the value of [ant] is ant14, the value of [rx] is hi or lo (for the receiver), and the value of [lna] can be lv, lh, hv or hh.''' | |||
<p style="color:#0000FF">'''FRM-HOME [ant]'''</p> | |||
:Homes the x-axis (receiver select) and position angle axis. | |||
<p style="color:#0000FF">'''FRM-RX-SEL [rx] [ant]'''</p> | |||
:Move x and z axes to select receiver. | |||
<p style="color:#0000FF">'''FRM-SET-PA [pa] [ant]'''</p> | |||
:Set the position angle, [pa] for polarization. Pointing to the south is 0 degrees. The PA can range from -90 to 90 degrees. | |||
<p style="color:#0000FF">'''FRM-X-OFFSET [xoff] [ant]'''</p> | |||
:Offset in x relative to the selected reciever. In effect until a new value is set or the Geo Brick is reset. | |||
<p style="color:#0000FF">'''FRM-Z-OFFSET [zoff] [ant]'''</p> | |||
:Offset in z relative to the selected reciever. In effect until a new value is set or the Geo Brick is reset. | |||
<p style="color:#0000FF">'''FRM-ABS-X [xpos] [ant]'''</p> | |||
:Set to an absolute x position. Not used. | |||
<p style="color:#0000FF">'''FRM-ABS-Z [zpos] [ant]'''</p> | |||
:Set to an absolute z position. Not used. | |||
<p style="color:#0000FF">'''FRM-KILL [ant]'''</p> | |||
:Kill all motors. They will be unpowered. | |||
<p style="color:#0000FF">'''FRM-ENABLE [ant]'''</p> | |||
:Enable all motors after a kill. | |||
<p style="color:#0000FF">'''OUTLET [out] [state] [ant]'''</p> | |||
:Turns the selected outlet on or off. [out] is a value from 1 to 8 and [state] is either on or off. | |||
<p style="color:#0000FF">'''ND-ON [ant]'''</p> | |||
:Turns the noise diode on via the power strip. | |||
<p style="color:#0000FF">'''ND-OFF [ant]'''</p> | |||
:Turns the noise diode off via the power strip. | |||
<p style="color:#0000FF">'''RX-SELECT [rx] [ant]'''</p> | |||
:Moves the requested receiver to focus and sets the RF switch appropriately. | |||
<p style="color:#0000FF">'''LNA-GATE1 [lna] [vg1] [ant]'''</p> | |||
:Sets the first gate bias on the selected amplifier to the request voltage ([vg1] in range of -2.0 to 2.0). Will only operate if that amplifier is enabled. | |||
<p style="color:#0000FF">'''LNA-GATE2 [lna] [vg2] [ant]'''</p> | |||
:Sets the second gate bias on the selected amplifier to the request voltage ([vg2] in range of -2.0 to 2.0). Will only operate if that amplifier is enabled. | |||
<p style="color:#0000FF">'''LNA-DRAIN [lna] [vd] [ant]'''</p> | |||
:Sets the drain bias ([vd] in range 0.0 to 2.0) on the selected amplifier. Will only operate if that amplifier is enabled. | |||
<p style="color:#0000FF">'''LNA-ENABLE [lna] [state] [ant]'''</p> | |||
:Turn the requested amplifier on or off. | |||
=== Local Commands === | |||
These commands are all executed locally. Any command with a '$' in front of it is a local command. | |||
<p style="color:#0000FF">'''$MK_TABLES [fname] [source]'''</p> | |||
:Creates the tracktable for the named [source], writes it to the filename given by [fname], for example, sun_tab.radec, pcal_tab.radec, or geosat_tab and stores it in the /parm directory on the ACC. This file can then be sent to the antennas via the TRACKTABLE command. This must be performed at the start of each scan in order for the antennas to track the source. | |||
<p style="color:#0000FF">'''$FEM_INIT <antlist>'''</p> | |||
:Invokes a sequence of commands to (1) read the current front-end power levels, (2) calculate any attenuation change needed to adjust the power levels to the range 1-4 dBm, and (3) send the attenuation adjustments to the antennas. The result is that the front end power levels are adjusted to this range. It acts on the antennas given in the antenna list <antlist>, or on all antennas in the current subarray if <antlist> is omitted. This command changes the gain calibration, so should only be done prior to the start of a day's observations if possible. This is part of the System Gain Cal procedure. | |||
<p style="color:#0000FF">'''$PLUSDELAY [nsec]'''</p> | |||
:Relay specific command that adds given delay argument (in nanoseconds) to the Ant 14 low frequency receiver. Delays both X and Y in the current delay center table. This writes the changed record as a new record in the SQL database. | |||
<p style="color:#0000FF">'''$CAPTURE-1S <stem>'''</p> | |||
:Capture 1 second of data on the dpp. <stem> is an optional string to add to the end of the capture filename. This will take a few seconds to complete. | |||
<p style="color:#0000FF">'''$WSCRAM-LIMIT [limit]'''</p> | |||
:Update the 27-m windscram limit. the limit is in miles per hour. | |||
<p style="color:#0000FF">'''$SCAN-START <NODATA>'''</p> | |||
:Starts data collection. Command by itself is normal scan start, while $SCAN-START NODATA means set up scan, but do not take data. The NODATA option is used for some calibrations. | |||
<p style="color:#0000FF">'''$SCAN-RESTART'''</p> | |||
:This command is for restarting a scan with the same setup as the previously running scan, where only the scan state must be turned on. | |||
<p style="color:#0000FF">'''$SCAN-STOP'''</p> | |||
:This command stops a scan. | |||
<p style="color:#0000FF">'''$PA-SWEEP [PA] [RATE]'''</p> | |||
:Rotate 27-m focus rotation mechanism to sweep through a given angle range (does nothing if PA adjustment routine is already running). The angle is swept from -[PA] to [PA] at rate of 1-degree-per-[RATE] (s) | |||
<p style="color:#0000FF">'''$PA-TRACK ant14 [CROSSED]'''</p> | |||
:Track 27-m focus rotation mechanism to correct for parallactic angle of given antenna (does nothing if antenna not correctly specified). [CROSSED] should have value TRUE or FALSE. | |||
<p style="color:#0000FF">'''$PA-STOP'''</p> | |||
:Aborts a running position-angle sequence (started by $PA-SWEEP or $PA-TRACK commands) that is controlling the Antenna 14 focus rotation mechanism. | |||
<p style="color:#0000FF">'''$TRIPS'''</p> | |||
:Send commands to update antenna trip information. | |||
<p style="color:#0000FF">'''$DLASWEEP [ant] [dla] [dlastop] <pol>'''</p> | |||
:Starts a relative delay sweep on antenna [ant] (an integer, i.e. ant1), <pol> ('X', 'Y', or if omitted, both) ranging from delay step [dla] to [dlastop]. This will sweep the delay by 1 step per second for delays from [dla] to [dlastop] relative to the current nominal delay. For example, $DLASWEEP 2 5 10 X will sweep the X delay on ant2 by adding 5 steps up to 10 steps, one step per second. The start and/or stop delays can be negative, but [dla] must be less than [dlastop]. Note, if [ant] is 0, the delay of the specified polarization is swept for all antennas. Used for some total power tests. | |||
<p style="color:#0000FF">'''$WAIT [secs]'''</p> | |||
:Waits the number of specified seconds before executing the next command. | |||
<p style="color:#0000FF">'''$PCYCLE [dev] [antlist]'''</p> | |||
:Cycle the power of some device (antenna controller, fem, or crio). If [dev] is omitted then the antenna controller is cycled. The options for [dev] are ANT, FEM or CRIO. | |||
<p style="color:#0000FF">'''$KATADC_GET'''</p> | |||
:Get the standard deviation for each KatADC (assumes frequency tuning is static). | |||
:'''Note, takes about 0.2 s for each active ROACH.''' | |||
<p style="color:#0000FF">'''$REWIND'''</p> | |||
:Get date of first line of current schedule and increment by 1 day, then auto-generate a new schedule. | |||
<p style="color:#0000FF">'''$LNA-INIT'''</p> | |||
:Get <span style="font-family:courier">LNA_settings.txt</span> file from ACC and send the series of commands needed to set the LNA voltages. | |||
<p style="color:#0000FF">'''$SUBARRAY' [antlist]'''</p> | |||
:Run the SUBARRRAY1 command if this is the master schedule, otherwise run the SUBARRAY2 command. | |||
== Useful Tools and Utilities == | |||
=== Screen Command === | |||
On linux systems, the screen command allows a program to be run in the background. This is particularly useful for processes that take a long time to complete. In addition it will display output when the screen is activated. | |||
To start a screen session, open up a terminal and issue the command: | |||
<pre style="font-family:courier">screen</pre> | |||
Text will appear and you will be prompted to press space or return. Just press return. | |||
Type in the command that you want to be performed. The process will then start. | |||
To scroll up and down within the screen press <span style="font-family:courier"><CRTL> A <ESC></span>. This enters Copy Mode. You can then use the up and down arrows to scroll. Press <ESC> to exit copy mode. Note that you cannot enter commands in copy mode. | |||
You can exit the screen by pressing <span style="font-family:courier"><CRTL> A D</span> | |||
The command will still be running. | |||
To re-open the screen at any time simply type: | |||
<pre style="font-family:courier">screen -r</pre> | |||
You can have more than one screen running at a time. In this case it is advisable to give a screen a name. For example: | |||
<pre style="font-family:courier">screen -S schedule</pre> | |||
will assign the name 'schedule' to the screen. To access this screen after it has been closed, use the command: | |||
<pre style="font-family:courier">screen -r schedule</pre> | |||
To list the currently active screens use the command: | |||
<pre style="font-family:courier">screen -ls</pre> | |||
To terminate a program running in a screen, from within the screen press <span style="font-family:courier"><CRTL> Z</span> | |||
In the example below the ping command was stopped and fives the following output: | |||
[[File:Screen-ping-stop.png]] | |||
The <span style="font-family:courier">[1]</span> is the job number. To completely terminate it issue the command: | |||
<pre style="font-family:courier">kill %1</pre> | |||
To close a screen session type <span style="font-family:courier">exit</span> | |||
If a screen is not responding, you can kill it and all programs running within it by pressing <span style="font-family:courier"><CRTL> A K</span> and then press <span style="font-family:courier">Y</span> when asked if you really want to kill the session. | |||
==== Determining if a Screen is Attached to the Current Terminal ==== | |||
To determine if a Screen is attached to the current terminal issue the command: | |||
<pre style="font-family:courier">echo $STY</pre> | |||
If the output is a blank line then the attached to the terminal. However if the name of a screen is displayed then that screen is attached. For example the output displayed when the schedule screen is attached will be similar to: | |||
<pre style="font-family:courier">17558.schedule</pre> | |||
==== Screens on Helios ==== | |||
The Helios <span style="font-family:courier">.bashrc</span> and <span style="font-family:courier">.screenrc</span> files have been modified so that the title of the terminal displays the screen name when you enter that screen. | |||
If the Operating system is reinstalled on helios then the following lines should be added to the bottom of the <span style="font-family:courier">.bashrc</span> file if they are not already present. | |||
<pre style="font-family:courier"> | |||
# This function sets the title of a Terminal window | |||
function settitle() { | |||
if [ -n "$STY" ] ; then # We are in a screen session | |||
echo "Setting screen titles to $@" | |||
printf "\033k%s\033\\" "$@" | |||
screen -X eval "at \\# title $@" "shelltitle $@" | |||
else | |||
printf "\033]0;%s\007" "$@" | |||
fi | |||
} | |||
</pre> | |||
Also add the following lines to the <span style="font-family:courier">.screenrc</span> file if they are not present. | |||
<pre style="font-family:courier">#This section will set the title on entering a screen | |||
termcapinfo xterm* 'hs:ts=\E]0;:fs=\007:ds=\E]0;\007' | |||
defhstatus "Screen $STY" | |||
hardstatus off | |||
</pre> | |||
Once done, you will either need to restart the bash session or issue the command: | |||
<pre style="font-family:courier">source .bashrc</pre> | |||
Note that after these titles will only be displayed on newly started screens, not ones that are running at the time the scripts were running. | |||
The above code is a slightly modified version of the code found here: https://code-and-hacks.peculier.com/articles/setting-terminal-title-in-gnu-screen/ | |||
=== df Command === | |||
On linux systems, the df command lists all of the file systems currently mounted on computer. | |||
The command is simply: | |||
<pre style="font-family:courier">df</pre> | |||
More usefully, issuing the command: | |||
<pre style="font-family:courier">df -h</pre> | |||
will display the file sizes in 'human readable' format. Below is an example from pipeline of the output of <span style="font-family:courier">df -h</span>: | |||
[[File:Df-output.png]] | |||
=== Whatup Program === | |||
The whatup program will display a plot of sources that are currently available. A sample plot is shown below. | |||
[[File:Whatup.png]] | |||
The program must be run from helios and ipython. To run ensure you are logged into a helios terminal and issue the following commands | |||
<pre style="font-family:courier">cd /common/python/current</p> | |||
ipython --pylab | |||
import whatup | |||
whatup.whatup() | |||
</pre> | |||
This will display a plot of sources (Altitude vs Time) visible to the 27m Antenna from the current time for the next 24 hours. The following optional arguments can be supplied: | |||
:dur - the duration of the plot in hours | |||
:t - the UT start time of the plot | |||
For example, the following commands | |||
<pre style="font-family:courier"> | |||
from util import Time</p> | |||
whatup.whatup(dur=6, t=Time("2020-10-01 14:00:00")) | |||
</pre> | |||
will display a plot from 2020-10-01 14:00:00 for a duration of 6 hours as shown below: | |||
[[File:Whatup_args.png]] | |||
=== renice: Changing priority of a program === | |||
If, on a linux system, a program is using to many resources, it is possible to use the <span style="font-family:courier">renice></span> command to set it to a different priority. | |||
From a terminal, type the command: | |||
<pre style="font-family:courier">ps -elf | grep [program]</pre> | |||
where <span style="font-family:courier">[program]<span> is the name of the program whose priority you wish to change. | |||
Below is an example with output: | |||
<pre style="font-family:courier"> | |||
user@dpp:/$ ps -elf | grep rsync | |||
4 S root 21761 0 80 0 - 16638 - 18:52 pts/3 00:00:00 sudo rsync -av --exclude=/dev --exclude=/data1/IDB --exclude=/lost+found --exclude=/media --exclude=/mnt --exclude=/nas1 --exclude=/proc --exclude=/sbdata --delete / /sbdata/dpp-backup/ | |||
4 S root 22708 2 80 0 - 47670 - 18:52 pts/3 00:01:25 rsync -av --exclude=/dev --exclude=/data1/IDB --exclude=/lost+found --exclude=/media --exclude=/mnt --exclude=/nas1 --exclude=/proc --exclude=/sbdata --delete / /sbdata/dpp-backup/ | |||
1 S root 22710 22709 1 80 0 - 24727 - 18:52 pts/3 00:00:34 rsync -av --exclude=/dev --exclude=/data1/IDB --exclude=/lost+found --exclude=/media --exclude=/mnt --exclude=/nas1 --exclude=/proc --exclude=/sbdata --delete / /sbdata/dpp-backup/ | |||
1 D root 22711 22710 9 80 0 - 34724 - 18:52 pts/3 00:04:38 rsync -av --exclude=/dev --exclude=/data1/IDB --exclude=/lost+found --exclude=/media --exclude=/mnt --exclude=/nas1 --exclude=/proc --exclude=/sbdata --delete / /sbdata/dpp-backup/ | |||
</pre> | |||
Here we looked for the rsync command and found 4 occurrences. The 8th column (marked here in red) is the priority. | |||
The priority ranges from -19 (highest priority) to 19 (lowest priority) | |||
To change the priority of a program issue the command: | |||
<pre style="font-family:courier">sudo renice -n [pr] -p [PID]</pre> | |||
where [pr] is the new priority number and [PID] is the process identification number. The PID is the 4th column across in the display above (marked in green). | |||
=== Caps Lock Toggle Using the Onscreen Keyboard === | |||
Occasionally, the caps lock key will get stuck in the on position. if you are logged in remotely, pressing caps lock on your keyboard will not fix this problem. Instead, follow the procedure below. | |||
:VNC into helios and click on the available helios terminal. | |||
:Enter the command <span style="font-family:courier">sudo onboard</span> | |||
:You will then need to enter the helios password. '''<span style="color:#FF0000">Note: If the caps lock is on you will need to press the shift key for any lowercase letters. For uppercase letters there will be no shift. That is, the keys for letters only will be inverted.'''</span> | |||
:The following screen will appear. When the caps lock is on, the caps key to the left of the onscreen keyboard is red. Note that the schedule will disappear as only windows that allow keyboard entry will be visible. However, it is still running. | |||
[[File: Onscreen_keyboard_caps_on.png]] | |||
:Click on the caps lock key to turn it off. The caps lock key should return to being black. | |||
:To exit the Onscreen keyboard click on the <span style="font-family:courier">[X]</span> on the upper right of the onscreen keyboard as shown below. | |||
[[File: Onscreen_keyboard_close_button.png]] | |||
:The Onscreen Keyboard will still be running in the background. To stop it, click on the terminal window where you started the keyboard and the press [CRTL] C. | |||
== Plotting Stateframe Data == | |||
It is often useful to be able to access and plot Stateframe data. | |||
=== Plotting Stateframe Data using the Stateframe Display === | |||
On the stateframe display, click on the Create tab shown below: | |||
[[File:Sf_create_tab.png]] | |||
A screen similar to that below will be displayed. If there is already a graph present click on the Clear Graph tab shown below. | |||
[[File:Sf_clear_tab.png]] | |||
By selecting items one at a time from left to write next to 'Select item to add' you can choose what to plot. The click on 'Add Selected Item' By repeating this process more than on data set can be plotted on a graph at a time. | |||
=== Using Python to plot Stateframe Data === | |||
This section describes, with an example, the procedure for plotting Stateframe data using python. This is useful as it allows time periods longer than an hour to be plotted. | |||
Suppose we wish to plot the vertical polarization power over a 1 hour period from 2020-10-05 00:00 to 2020-10-05 01:00. | |||
Firstly, from a pipeline terminal, access ipython: | |||
<pre style="font-family:courier">ipython --pylab</pre> | |||
Next import the required libraries: | |||
<pre style="font-family:courier"> | |||
import dbutil as db | |||
from util import Time | |||
import numpy as np | |||
</pre> | |||
Now set up the cursor: | |||
<pre style="font-family:courier">cursor = db.get_cursor()</pre> | |||
The time range is set as follows (Just replace the times in quotes with new start and end times): | |||
<pre style="font-family:courier">trange=Time(['2020-10-05 00:00','2020-10-05 01:00']).lv.astype(int)</pre> | |||
Now we set up a query string which will search the data base: | |||
<pre style="font-family:courier">query = 'select Timestamp,Ante_Fron_FEM_VPol_Power from fV66_vD15 where (I15 % 15) = 3 and Timestamp between '+str(trange[0])+' and '+str(trange[1])+' order by Timestamp'</pre> | |||
Some explanation here is required. | |||
Timestamp is the time for each data point. | |||
Ante_Fron_FEM_VPol_Power is the variable for the VPOL power. The name of each variable can be retrieved by looking at the variables an the Create tab on the stateframe display. Note that except for the last variable, it is only the first 4 characters (or fewer if there are less than 4) that make up the name. | |||
fV66_vD15 is the database from which the data is to be retrieved. | |||
(I15 % 15) = 3 will give the data for the antenna. I15 denotes that there are 15 antennas. This takes the record number mod 15 and will only extract a record when this equals 3 (antenna 4, as the values here are 0 indexed). | |||
It will also only extract values in the specified time range. | |||
Finally we want the data ordered by timestamp. | |||
Now we retrieve the requested data: | |||
<pre style="font-family:courier">data, msg = db.do_query(cursor,query)</pre> | |||
The data is stored in a dictionary. We can view the keys as follows: | |||
<pre style="font-family:courier">data.keys()</pre> | |||
This will produce an output as follows: | |||
<pre style="font-family:courier">[u'Timestamp', u'Ante_Fron_FEM_VPol_Power']</pre> | |||
We convert the timestamps to numpy times: | |||
<pre style="font-family:courier">dt = np.array(Time(data['Timestamp'].astype(float), format = 'lv').isot,dtype = 'datetime64')</pre> | |||
The labels for the plot can be set if desired: | |||
<pre style="font-family:courier"> | |||
title('VPOL Power vs Time') | |||
xlabel('Universal Time') | |||
ylabel('Power (dB)') | |||
</pre> | |||
Finally the data is plotted: | |||
<pre style="font-family:courier">plot(dt,data['Ante_Fron_FEM_VPol_Power'])</pre> | |||
A sample plot is shown below: | |||
[[File:Sample_sf_plot.png]] | |||
This plot looks rather cluttered. The number of points can be reduced if we modify our query: | |||
<pre style="font-family:courier">query = 'select Timestamp,Ante_Fron_FEM_VPol_Power from fV66_vD15 where (I15 % 15) = 3 and Timestamp between '+str(trange[0])+' and '+str(trange[1])+' and (cast(Timestamp as bigint) % 10) = 0 order by Timestamp'</pre> | |||
We then request the data again,convert the timestamps to numpy times and replot the data producing: | |||
[[File:Sample_sf_plot_reduced_points.png]] | |||
Suppose we want to plot both the HPol Power and VPol power on the same plot. This is not difficult to do. We simply modify our query again: | |||
<pre style="font-family:courier">query = 'select Timestamp,Ante_Fron_FEM_VPol_Power,Ante_Fron_FEM_HPol_Power from fV66_vD15 where (I15 % 15) = 3 and Timestamp between '+str(trange[0])+' and '+str(trange[1])+' and (cast(Timestamp as bigint) % 10) = 0 order by Timestamp'</pre> | |||
Now HPol has been added and we just send this query as above. If we look at the keys now we see: | |||
<pre style="font-family:courier">[u'Timestamp', u'Ante_Fron_FEM_HPol_Power', u'Ante_Fron_FEM_VPol_Power']</pre> | |||
To plot this data as a scatter plot we use the following commands: | |||
<pre style="font-family:courier">hpol, = plot(dt,data['Ante_Fron_FEM_HPol_Power'].astype(float),'o', label='HPOL') | |||
vpol, = plot(dt,data['Ante_Fron_FEM_VPol_Power'],'o', label='VPOL') | |||
legend(handles=[hpol,vpol]) | |||
</pre> | |||
which produces this plot: | |||
[[File:HPOL_VPOL_scatter.png]] | |||
== Power Meter Setup == | |||
The user manual for the power meter can be found at https://literature.cdn.keysight.com/litweb/pdf/E4418-90032.pdf | |||
Before use the power meter will need to be zeroed and calibrated. | |||
1. Ensure that the sensor is not connected to anything. | |||
2. Press the ZERO/CAL button. | |||
3. Press the button next to [Zero] displayed on the screen. It will take several seconds to zero. | |||
4. Next remove the SMA adaptor from the end of the sensor and connect the sensor to the POWER REF socket on the power meter as shown below. | |||
[[File:Power_Meter_Cal.jpg]] | |||
5. Press the button next to [CAL] displayed on the screen. It will take several seconds. | |||
6. The SMA power sensor can now be disconnected from the POWER REF socket and the SMA adaptor reconnected. | |||
== Vector Network Analyser Setup == | |||
[[File:VNA_Photo.jpg]] | |||
=== Basic startup and operation === | |||
Turn on the VNA using the Power button at the front. Note that there is also a power switch on the back of the VNA. Ensure this is on. | |||
Connect the blue SMA cables to the VNA. | |||
Press the power button. | |||
Press the 'BW-Avg Power' soft-key. | |||
Click on Output Power. | |||
Ensure RF-off is checked. | |||
Under Power, enter the VNA output Power. | |||
Press the 'Freq' soft-key | |||
Enter the start frequency and end frequency. | |||
Connect port 1 to the input of the device to be tested. | |||
Connect port 2 to the output of the device to be tested. | |||
Press the 'BW-Avg Power' soft-key. | |||
Uncheck RF-off. | |||
=== Autoscale Display === | |||
Press the 'Scale' soft key. | |||
Click on Auto-Scale Trace. | |||
=== Average Trace === | |||
Press the 'BW-Avg Power' soft-key. | |||
Select Moving Average. | |||
Set Factor. This is the number of sweeps the trace is averaged over. | |||
Check On. | |||
=== Saving a Trace === | |||
Press the 'Trace' soft key. | |||
Click on Trace Data. | |||
Click on Ascii | |||
Under Contents select Active Trace. | |||
Under Output format select dB Mag-Phase. | |||
Under Field Separator select Comma. | |||
Under Decimal select Point. | |||
Enter the folder and filename. | |||
Click on Save. | |||
== Other == | |||
=== DPP Fix Packets Details === | |||
==== Basic Operation and Monitoring ==== | |||
As of August 2021 the interrupt priority is handled largely automatically. This section describes the updated programs. | |||
The program that handles reassignment of the CPUs and packet monitoring in called <span style="font-family:courier">dpp_fix_packets.py</span> and is located in the <span style="font-family:courier">/common/python/current/</span> folder. | |||
However this is typically not run directly. Rather it is run from a script on the DPP: <span style="font-family:courier">/home/user/test_svn/shell_scripts/start_fix_packets.sh</span> | |||
This script checks to see if the <span style="font-family:courier">dpp_fix_packets.py</span> program is running. If it is not then it will restart it. Note that the actual line in the script that starts <span style="font-family:courier">dpp_fix_packets.py</span> is as follows: | |||
<pre style="font-family:courier">screen -S fixpackets -d -m python /common/python/current/dpp_fix_packets.py</pre> | |||
This command starts the <span style="font-family:courier">dpp_fix_packets.py</span> in a screen named "fixpackets" in detatched mode ("-d -m"). | |||
To access the screen, and hence the output of the program simply type <span style="font-family:courier">screen -r fixpackets</span> | |||
This should show output that updates every minute as shown below: | |||
[[file:Dpp_output.png]] | |||
'''Note that I will normally show the fixpackets screen in a terminal after I have rebooted the DPP (OG)''' | |||
Information is also written to the <span style="font-family:courier">/common/webplots/dpp_fix_packets_log.txt</span> file. This contains the last 20 lines of significant output of the <span style="font-family:courier">dpp_fix_packets.py</span> program. This file is read by the stateframe display. In addition it writes the CPUs currently used by the fix packets program to the <span style="font-family:courier">/common/webplots/dpp_cpu.txt</span> file. This is also read by the stateframe display. | |||
At the bottom of the stateframe display is a section titled <span style="font-family:courier">Last DPP Fix Packets Messages</span>. This displays the last 3 messages by <span style="font-family:courier">dpp_fix_packets.py</span>. An example is given below: | |||
[[file:Stateframe_dpp_msg.png]] | |||
This will display potentially 4 different types of messages: | |||
:<span style="font-family:courier">Packet Loss Detected</span>: This notifies that there was a packet loss and the interfaces are being reset. | |||
:<span style="font-family:courier">dpp_fix_packets.py has been restarted</span>: Indicates that the fix packets program has restarted. This will normally occur after a reboot of the DPP. | |||
:<span style="font-family:courier">Resetting CPUs - Using CPUs 18 and 19</span>: Notifies that the CPUs being used were change. Valid CPU pairs are [18 19], [20 21], [21 22]. | |||
:<span style="font-family:courier">DPP REBOOT REQUIRED!</span>: This indicates that all CPU pairs have been used and that the DPP should be rebooted. | |||
==== Startup Script and Automatic Monitoring ==== | |||
The <span style="font-family:courier">/home/user/test_svn/shell_scripts/start_fix_packets.sh</span> is run at DPP startup. The following command is placed in the crontab file: | |||
<pre style="font-family:courier">@reboot /bin/bash /home/user/test_svn/shell_scripts/start_fix_packets.sh</pre> | |||
This starts the script on reboot (or startup). | |||
Additionally this same script is run every 10 minutes in order to ensure that the program is still running. It will not restart <span style="font-family:courier">dpp_fix_packets.py</span> if it is already running. This command is also present in the crontab file: | |||
<pre style="font-family:courier">*/10 * * * * /home/user/test_svn/shell_scripts/start_fix_packets.sh</pre> | |||
=== Windscram === | |||
A windscram occurs when the wind exceeds 18 miles/hour for 5 minutes. While a windscram can occur at any time, it is only important during a phasecal, as this is typically the only time that the 27m antenna is tracking. The 27m will stow during a windscram. Note that when the wind drops the antenna will not resume tracking. If the wind has dropped for a significant period of time, you can resume 27m operation by issuing the command: | |||
<pre style="font-family:courier">track ant14</pre> | |||
from the schedule window. | |||
You can check the wind speed history by clicking on temps. The solid gray line is the average wind speed. | |||
=== Reloading the crio.ini File === | |||
<span style="color:#FF0000">'''DO THIS WITH EXTREME CAUTION. BE ABSOLUTELY CERTAIN THAT RELOADING THE CRIO FILE IS REQUIRED.'''</span> | |||
For antenna 11, see the special case here: | |||
After uploading the new crio.ini file the gains and pointing may also need to be updated. | |||
==== Manually uploading the crio.ini file ==== | |||
From helios, open a terminal and type <span style="font-family:courier">cd /home/sched/Dropbox/PythonCode/Current/crio_inis</span> | |||
For the antenna that needs to be reset, find the most recent '.ini' file. For example, for antenna 10 this may be 'crio10-2019-09-28.ini'. Make a note of this file. | |||
Enter the command <span style="font-family:courier">ftp crio10.solar.pvt</span>. Replace crio10 with the apropriate CRIO number. | |||
Enter the username and password when prompted. | |||
Enter the following commands: | |||
<pre style="font-family:courier"> | |||
cd ni-rt/startup | |||
put crio10-2019-09-28.ini crio.ini | |||
bye | |||
</pre> | |||
replacing 'crio10-2019-09-28.ini' with the appropriate file for the CRIO that needs to be reset. | |||
The above commands have reloaded the crio.ini file. The CRIO now needs to be reset. For example, Antenna 10 will be reset by issuing the following commands from the schedule window: | |||
<pre style="font-family:courier"> | |||
sync ant10 | |||
tracktable sun_tab.radec ant10 | |||
track | |||
</pre> | |||
==== Using ipython to Upload the crio.ini File ==== | |||
From helios, open a terminal and access ipython: | |||
:<pre style="font-family:courier">ipython --pylab</pre> | |||
Load the crio.py file by entering: | |||
:<pre style="font-family:courier">import crio</pre> | |||
Simply issue the command: | |||
:<pre style="font-family:courier">crio.reload_crio_ini('ant#')</pre> | |||
where # is the antenna number. The most recent crio.ini file will be uploaded for that antenna. | |||
=== Power Meter Setup === | |||
The user manual for the power meter can be found at https://literature.cdn.keysight.com/litweb/pdf/E4418-90032.pdf | |||
Before use the power meter will need to be zeroed and calibrated. | |||
1. Ensure that the sensor is not connected to anything. | |||
2. Press the ZERO/CAL button. | |||
3. Press the button next to [Zero] displayed on the screen. It will take several seconds to zero. | |||
4. Next remove the SMA adaptor from the end of the sensor and connect the sensor to the POWER REF socket on the power meter as shown below. | |||
[[File:Power_Meter_Cal.jpg]] | |||
5. Press the button next to [CAL] displayed on the screen. It will take several seconds. | |||
6. The SMA power sensor can now be disconnected from the POWER REF socket and the SMA adaptor reconnected. | |||
=== Moving the New Antennas Manually === | |||
Power off the antenna by turning the power switch at the bottom right of the Antenna Control Box. | |||
Switch the Maint/Norm Switch to Maint. | |||
Switch the Remote Switch to Remote. | |||
[[File:AntControlBox.png]] | |||
Remove the block from the hand controller port. | |||
'''Remember to place the block back after you have finished working on the antenna. It will not run in remote without it!''' | |||
[[File:Handcontrollerport.png]] | |||
Connect the hand controller to the port. | |||
[[File:Handcontrollerconnected.png]] | |||
Turn the power switch back on. | |||
The antenna can now be moved to a suitable position using the azimuth and elevation controls on the hand controller. | |||
[[File:Handcontroller.png]] | |||
=== Moving the Old Antennas Manually === | |||
At the lower right of the control box, there is a panel for controlling the antenna manually as shown below. | |||
[[File:Old_Ant_Controller.jpg]] | |||
Move the bottom center switch to Local. The antenna can now be positioned using the HA and Dec switches. | |||
=== Antenna Stowing at End of Day === | |||
Antennas 1 to 8 are not stowed after observations. Therefore, the antennas will be highlighted as red as they will still be tracking (see image below). There is no need to take any action for these antennas. | |||
[[File:Stateframe_End_of_Day_Ant.png]] | |||
Antenna 11 will need to be stowed manually after observations are complete. To do this, enter the commands below: | |||
<pre style="font-family:courier"> | |||
stop ant11 | |||
stow ant11 | |||
</pre> | |||
=== Service Stow === | |||
Use this procedure to place the antenna into its service stow position. | |||
<span style="color:#FF0000">'''NOTE: do NOT use the service command. This seems to also reset the CRIO.'''</span> | |||
From the schedule window issue the command: | |||
<pre style="font-family:courier">position 225 15 ant#</pre> | |||
where ant# is the antenna to place into service stow. | |||
=== Stopping and Restarting Helios VNC === | |||
If the helios VNC server needs to be stopped then you will need to find the process ID number (PID#). From a helios terminal issue the following command: | |||
<pre style="font-family:courier">ps -A | grep vnc</pre> | |||
You will see a line that looks something like: | |||
<pre style="font-family:courier">26626 ? 00:00:00 x11vnc</pre> | |||
The number on the left is the PID#, in this case 26626. | |||
To stop VNC issue the command | |||
<pre style="font-family:courier">kill PID#</pre> | |||
where in this case PID# would be 26626 | |||
'''<span style="color:#FF0000">Note that doing this will cut the VNC connection to any users that are currently logged in.</span>''' | |||
To restart VNC issue the command: | |||
<pre style="font-family:courier">x11vnc -shared -display :0 -forever -noxrecord -clip 1920x1200+0+0 -bg -usepw -rfbport 20000 -auth /home/sched/.Xauthority</pre> | |||
Note that VNC is started when Helios is started. The startup script for VNC is located in: <span style="font-family:courier">/etc/init/x11vnc.conf</span> | |||
=== Helios Bash Aliases === | |||
The aliases for various bash command can be found in the <span style="font-family:courier">.bash_aliases</span> file | |||
=== Shutting off the 27m Control System === | |||
At times during maintenance on the 27m antenna it may be necessary to turn off the control system to prevent anyone from moving the antenna. To do this perform the following steps. | |||
:Log into the feanta machine from helios: | |||
<pre style="font-family:courier">ssh antctl@feanta</pre> | |||
:Issue the command (note you can use the up arrow until you find the command): | |||
<pre style="font-family:courier">/home/antctl/starburst/femTools/src/starburstControl stop</pre> | |||
:Log out of feanta by issuing the command: | |||
<pre style="font-family:courier">exit</pre> | |||
:There is a crontask that periodically restarts the control system on helios. Issue the command: | |||
<pre style="font-family:courier">crontab -e</pre> | |||
:This will allow you to edit the crontab file. Scroll down to find the line that reads: | |||
<pre style="font-family:courier">1 1,5,9,13,17,21 * * * ssh -t antctl@feanta /home/antctl/starburst/femTools/src/starburstControl start</pre> | |||
:Place a # in front of this line so that it reads: | |||
<pre style="font-family:courier">#1 1,5,9,13,17,21 * * * ssh -t antctl@feanta /home/antctl/starburst/femTools/src/starburstControl start</pre> | |||
:Press CRTL x and then answer Y to save the file. | |||
Note that when maintenance has finished you will need to edit the crontab file again and remove the # from that line. | |||
=== Installing Computer Updates === | |||
Pipeline, Helios and the DPP require regular updates. To install updates, follow the following procedure: | |||
:Log in to a terminal on a computer that is to be updated. | |||
:Issue the following command: | |||
<pre style="font-family:courier">sudo apt update && sudo apt upgrade -y</pre> | |||
:Restart the computer by: | |||
<pre style="font-family:courier">sudo reboot now</pre> | |||
=== Setting up SSH Keys === | |||
To access a computer without a password via SSH, you cant set up SSH keys that allow password-less access between computers. These instructions are for linux. | |||
Open a terminal on the local computer. Ensure that you are logged in as the appropriate user. Issue the command: | |||
<pre style="font-family:courier">ssh-keygen -t dsa -f {remote_computer}</pre> | |||
where <span style="font-family:courier">{remote_computer}</span> is the name of the computer that you wish to access. | |||
This will create two files: | |||
:<p style="font-family:courier">{remote_computer}</p> | |||
:<p style="font-family:courier">{remote_computer}.pub</p> | |||
Now use scp to copy the <span style="font-family:courier">{remote_computer}.pub</span> file to the remote computer. | |||
<pre style="font-family:courier">scp {remote_computer}.pub {user}@{remote_computer}:</pre> | |||
Enter the password when prompted. Note that <span style="font-family:courier">{user}</span> is the user name of the account that you wish to access. | |||
Log into the remote computer using ssh. | |||
<pre style="font-family:courier">ssh {user}@{remote_computer}</pre> | |||
Now copy the contents of the <span style="font-family:courier">{remote_computer}.pub</span> file to <span style="font-family:courier">~/.ssh/authorized_keys2</span> | |||
<pre style="font-family:courier">cat {remote_computer}.pub >> ~/.ssh/authorized_keys2</pre> | |||
You may need to change permissions on the new file: | |||
<pre style="font-family:courier">chmod 600 ~/.ssh/authorized_keys2</pre> | |||
Remove the original file: | |||
<pre style="font-family:courier">rm {remote_computer}.pub</pre> | |||
Logout from the remote computer: | |||
<pre style="font-family:courier">exit</pre> | |||
Start the ssh agent: | |||
<pre style="font-family:courier">eval `ssh-agent -s`</pre> | |||
Now add the identity: | |||
<pre style="font-family:courier">ssh-add ~/.ssh/identity_{remote_computer}</pre> | |||
You should now be able to log in to the remote computer without a password. | |||
=== Changing Antenna Settings at the Controller === | |||
At the antenna, place the antenna into standby. | |||
Make sure you select the correct controller (Azimuth or Elevation). | |||
On the controller, press M to enable menu selection. | |||
Use the left and right arrows to select the appropriate menu and the up and down arrows to select the appropriate parameters. | |||
Press M again to edit the chosen parameter. | |||
Use the left and right arrows to shift to the digit you want to change and use the up and down arrows to enter the required digit. | |||
Once the parameter has been updated, press M to get back to menu selection. | |||
If setting menu 20 parameters, go to parameter 15.19 and press the up arrow. This option will change from off to on and then back to off. This will save the parameter. | |||
For any other menus, go to parameter 0.00 and change it to 1000. | |||
Press M to exit the menu selection. | |||
Return the antenna to operate and reboot the antenna for changes to take affect. | |||
== Data Analysis == | |||
=== Installing Suncasa on Ubuntu 22 === | |||
Some of the libraries (including python3.8) that are required for suncasa are not part of the Ubuntu 22 distribution. The following is a summary of the instructions to install suncasa on Ubuntu 22 and later versions. | |||
Update Ubuntu and add old repositories: | |||
<pre style="font-family:courier"> | |||
sudo apt update && sudo apt upgrade | |||
sudo apt install software-properties-common | |||
sudo add-apt-repository ppa:deadsnakes/ppa | |||
</pre> | |||
Install python3.8: | |||
<pre style="font-family:courier">sudo apt install python3.8</pre> | |||
Install python 3.8 virtual environment: | |||
<pre style="font-family:courier">sudo apt-get install python3.8-venv</pre> | |||
Create a suncasa python environment: | |||
<pre style="font-family:courier">python3.8 -m venv suncasaenv</pre> | |||
Activate the suncasa environment: | |||
<pre style="font-family:courier">source suncasaenv/bin/activate</pre> | |||
Install pip, suncasa and ipython: | |||
<pre style="font-family:courier"> | |||
pip install --upgrade pip wheel | |||
pip install suncasa | |||
pip install ipython3 | |||
</pre> | |||
Cleanup the cache so different version of python and ipython are not being used: | |||
<pre style="font-family:courier">hash -r</pre> | |||
Check that the installation works: | |||
<pre style="font-family:courier"> | |||
ipython3 | |||
import suncasa | |||
help(suncasa) | |||
import casatasks | |||
help(casatasks) | |||
</pre> | |||
To exit from the suncasa environment: | |||
<pre style="font-family:courier">deactivate</pre> | |||
Exit from ipython: | |||
<pre style="font-family:courier">exit</pre> | |||
Set up EOVSA packages and site: | |||
<pre style="font-family:courier"> | |||
printf "import sys \nimport os \nimport sysconfig \nimport casatools \nimport casadata \nimport time \nlogfile='casalog-{}.log'.format(time.strftime('%%Y%%m%%d-%%H',time.localtime())) \ntelemetry_enabled = False \ncrashreporter_enabled = True \ntb=casatools.table() \nospathsep = os.path.sep \nlibpath = sysconfig.get_paths()['purelib'] \nobsdict = {'MJD': 57447.0, 'Name': 'EOVSA', 'Type': 'WGS84', 'Long': -118.287, \n 'Lat': 37.2332, 'Height': 1207.13, 'X': 0.0, 'Y': 0.0, 'Z': 0.0, \n 'Source': 'Dale Gary'} \nobstable = os.path.join(casadata.datapath,'geodetic','Observatories') \ntb.open(obstable, nomodify=True) \nif 'EOVSA' not in tb.getcol('Name'): \n print('Adding EOVSA to the Observatories') \n tb.close() \n tb.open(obstable, nomodify=False) \n nrows = tb.nrows() \n tb.addrows(1) \n for k in obsdict.keys(): \n tb.putcell(k, nrows, obsdict[k]) \ntb.close() \n" > $HOME/.casa/config.py | |||
echo "sitepackagepath = '$HOME/suncasaenv/lib/python3.8/site-packages'" >> $HOME/.casa/config.py | |||
echo "if sitepackagepath not in sys.path:" >> $HOME/.casa/config.py | |||
echo " sys.path.append(sitepackagepath)" >> $HOME/.casa/config.py | |||
</pre> | |||
To exit the suncasa environment: | |||
<pre style="font-family:courier">deactivate</pre> | |||
Note that you must be in the suncasa environment to use suncasa! | |||
=== EOVSA synoptic Fits Images === | |||
This section is mostly to do with how to load an view EOVSA synoptic FITS images. | |||
From pipelne change to the <span style="font-family:courier">/common/python/mapping</span> folder. | |||
From ipython, issue the following commands to load the required libraries: | |||
<pre style="font-family:courier"> | |||
from fits2map import * | |||
from plot_map import * | |||
</pre> | |||
The files can be found at http://www.ovsa.njit.edu/fits/synoptic/. To see what files are available click on the appropriate folder. | |||
To load a particular file you would issue the command: | |||
<pre style="font-family:courier">eomap1 = fits2map("eomap1=fits2map("http://www.ovsa.njit.edu/fits/synoptic/2020/05/19/eovsa_20200519.spw06-10.tb.disk.fits")</pre> | |||
In this case it would load a full disk image from 2020-05-19 created from bands 6 to 10 into eomap1. | |||
To view the image issue the command: | |||
<pre style="font-family:courier">plot_map(eomap1)</pre> | |||
This will produce a plot similar to that below. | |||
[[File:Eomap.png]] | |||
The image parameters are stored as a dictionary and can be viewed by: | |||
<pre style="font-family:courier">eomap1.keys()</pre> | |||
For more information see http://www.ovsa.njit.edu/wiki/index.php/Mapping_Software | |||
== Antenna Optical Power at the DCM == | |||
The following table shows the measured optical power for each antenna at the DCM measured at the given date. Values of HI indicate the power meter saturated. | |||
{| class="wikitable" style="margin:auto" | |||
|+ Antenna Optical Power | |||
|- | |||
! Ant # !! Power (dB) !! Date | |||
|- | |||
| 1 || HI || 2022-05-18 | |||
|- | |||
| 2 || HI || 2022-05-18 | |||
|- | |||
| 3 || HI || 2022-05-18 | |||
|- | |||
| 4 || HI || 2022-05-18 | |||
|- | |||
| 4 || HI || 2022-05-18 | |||
|- | |||
| 5 || HI || 2022-05-18 | |||
|- | |||
| 6 || HI || 2022-05-18 | |||
|- | |||
| 7 || 3.88 || 2022-05-18 | |||
|- | |||
| 8 || HI || 2022-05-18 | |||
|- | |||
| 9 || 5.36 || 2022-05-18 | |||
|- | |||
| 10 || HI || 2022-05-18 | |||
|- | |||
| 11 || 4.40 || 2022-05-18 | |||
|- | |||
| 12 || HI || 2022-05-18 | |||
|- | |||
| 13 || HI || 2022-05-18 | |||
|} | |||
== Maintenance == | |||
=== Routine Maintenance === | |||
==== Old Antennas (9-11,13) ==== | |||
{| class="wikitable" | |||
|+ Greasing | |||
! Antenna | |||
! Last Done | |||
! Next Scheduled | |||
|- | |||
| 9 || 2022-09-02 || 2023-03-02 | |||
|- | |||
| 10 || 2022-09-02 || 2023-03-02 | |||
|- | |||
| 11 || 2022-09-02 || 2023-03-02 | |||
|- | |||
| 13 || 2022-09-02 || 2023-03-02 | |||
|- | |||
|} | |||
== Antenna Components == | |||
=== Spin RF Feeds === | |||
{| class="wikitable" | |||
! Antenna | |||
! Serial No. | |||
! Tag No. | |||
|- | |||
| 1 || CC2D03Q18R || 52393 | |||
|- | |||
| 2 || CC2D01Q18R || 52394 | |||
|- | |||
| 3 || CC2D05Q18R || 52395 | |||
|- | |||
| 4 || CC2D08Q18R || 52396 | |||
|- | |||
| 5 || CC2D07Q18R || 52397 | |||
|- | |||
| 6 || CC2D11Q18R || 52398 | |||
|- | |||
| 7 || CC2D10Q18R || 52399 | |||
|- | |||
| 8 || CC2D12Q18R || 52400 | |||
|- | |||
| 9 || CC2D04Q18R || 52401 | |||
|- | |||
| 10 || CC2D06Q18R || 52402 | |||
|- | |||
| 11 || DU2D01Q18R || 52403 | |||
|- | |||
| 12 || CC2D09Q18R || 52404 | |||
|- | |||
| 13 || CC2D02Q18R || 52405 | |||
|- | |||
|} | |||
=== Antenna 1 === | |||
{| class="wikitable" | |||
! Component | |||
! Module | |||
! Model No. | |||
! Serial No. | |||
! Purchase Date | |||
! Repair Date | |||
! Install Date | |||
|- | |||
| LNA (H) || FEM || || || || || | |||
|- | |||
| LNA (V) || FEM || || || || || | |||
|- | |||
| Attenuator 1 (H) || FEM || || || || || | |||
|- | |||
| Attenuator 2 (H) || FEM || || || || || | |||
|- | |||
| Attenuator 1 (V) || FEM || || || || || | |||
|- | |||
| Attenuator 2 (V) || FEM || || || || || | |||
|- | |||
| Optical Link (H) || FEM || || || || || | |||
|- | |||
| Optical Link (V) || FEM || || || || || | |||
|- | |||
| Temperature Controller || AUX || || || || || | |||
|- | |||
| CRIO || ANT || || || || || | |||
|- | |||
|} | |||
=== Component Supplier List === | |||
{| class="wikitable" style="text-align:center;" | |||
! Component | |||
! Model No. | |||
! Spares On Site | |||
! Purchase Date | |||
! Supplier | |||
! Website | |||
! Phone No. | |||
|- | |||
| LNA || LNA-30-00101800-25-10P-MM || 2 || || L3Harris Narada Miteq || https://nardamiteq.com/ || 631-231-1700 | |||
|- | |||
| LNA || AFS4-00101800-25-10P-12V-4 || 3 || || L3Harris Narada Miteq || https://nardamiteq.com/ || 631-231-1700 | |||
|- | |||
| Optical Link (1544.47nm) || LT-20-M || 1 || || OEQuest || https://oequest.com/ || 602-343-1496 | |||
|- | |||
| Optical Link (1562nm) || LT-20-M || 1 || || OEQuest || https://oequest.com/ || 602-343-1496 | |||
|- | |||
| 2CH DWDM Demux Module || BWDM21D0CRV11+BWDM21D0CRV13 || 1 || || OEQuest || https://oequest.com/ || 602-343-1496 | |||
|- | |||
| Inclinometer || DAS-90-A || 2 || || Level Developments || https://www.leveldevelopments.com/ || 312-465-1082 | |||
|- | |||
| Temperature Controller || 145001 (TC-XX-PR-59) Rev 2,4 || 2 || || Laird Thermal Systems || https://www.lairdthermal.com/ || 919-597-7300 | |||
|- | |||
| CRIO || cRIO-9074 || 1 || || National Instruments || https://www.ni.com/en-us.html || 888-280-7645 | |||
|- | |||
| Mag Switch || XS3P12NA340 || 1 || || Telemecanique Sensors || https://tesensors.com/global/en || 888-280-7645 | |||
|- | |||
| Attenuator || || || || || || | |||
|- | |||
|} | |||
Latest revision as of 22:08, 23 April 2024
List of Routine Tasks
Daily Tasks
Check the following pages:
http://ovsa.njit.edu/status.php The all-day plot from the previous day is at the bottom of the page. The last 45 minutes of data is at the top right of the page or direct link is here: http://ovsa.njit.edu/flaremon/XSP_latest.png
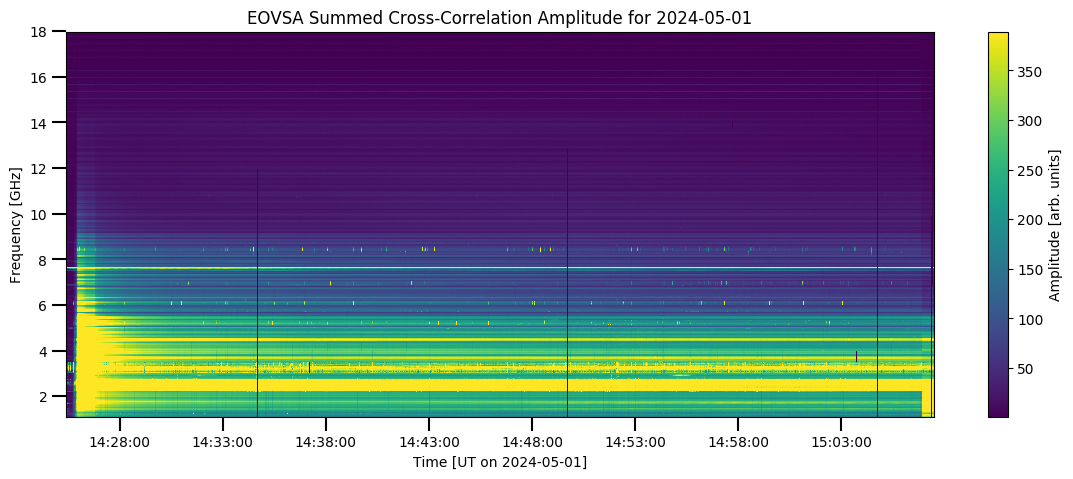
http://www.ovsa.njit.edu/browser/ This defaults to showing pipeline output from two days previous.
http://ovsa.njit.edu/pointing/ The latest pointing plot(s) at the bottom.
http://ovsa.njit.edu/phasecal/ The latest phasecal vs. frequency is somewhere in the middle, i.e. the bottom of the list of pcf*.png files.
http://ovsa.njit.edu/EOVSA/ant_status.php Current antenna status.
** Ensure that the schedule is running and updating. Check that the stateframe is updating. Check frequently! **
Check that the data files are being updated. Goto the user@dpp terminal and type:
ls /data1/IDB |tail
Check that the adc_plot.py program is running.
Regularly check to see if a flare is in progress (http://ovsa.njit.edu/status.php). If there is a flare in progress you may need to pause the schedule (http://www.ovsa.njit.edu/wiki/index.php/Owen%27s_Notes#Pausing_and_Adjusting_the_Schedule).
Perform a Phase Calibration
Check that the network monitoring function (fix_packets()) is working on the DPP. It can also be seen as dropouts on the spectrogram (http://ovsa.njit.edu/status.php).
Check the Front End Power on the stateframe display. These values should be between about 0 and 3dBm. If the front end power looks suspicious, you can check it by plotting the front end power vs time (see here for instructions: http://www.ovsa.njit.edu/wiki/index.php/Owen%27s_Notes#Plotting_Stateframe_Data).
If there are any problems with any of the antennas goto http://ovsa.njit.edu/EOVSA/ant_status/ant_status_form.php and fill out the appropriate form.
Weekly Tasks
Perform a Gain Calibration
Check the NJIT Vehicle:
- Ensure fluid levels are good.
- Check the rodent baits and replace as needed.
- Check the engine compartment for signs of rodents.
- Drive the vehicle for at least 1/2 hour per week.
Monthly Tasks
Perform a Pointing Calibration
Login Procedures
Remote Login
The computers can be accessed remotely using SSH and VNC. Since I use Linux (Ubuntu) these instruction are for that OS.
Helios
To VNC into Helios, open a terminal and type the following command:
ssh -L 5902:helios.solar.pvt:20000 oweng@ovsa.njit.edu
Note replace oweng with your gateway login name)
Then open Remmina Remote Desktop Client. Make sure VNC is selected at the top left. Type in:
localhost:2
and enter the password when prompted.
The Helios display should now be visible.
Occasionally, the VNC connection will be lost. If this occurs the following procedure need to be performed.
From a new terminal window type:
ssh -L 8887:helios.solar.pvt:22 oweng@ovsa.njit.edu
From another terminal issue the command:
ssh -p 8887 sched@localhost
Now type in:
x11go
Now restart the VNC client.
Note that the VNC connection issue should now be resolved. If you notice it dropping out let Owen know what you were doing at the time.
Pipeline
To log in to pipeline, from a terminal enter the command:
ssh -L 8888:pipeline.solar.pvt:22 oweng@ovsa.njit.edu
Then from a new terminal enter:
ssh -p 8888 user@localhost
Win1
To log in to the win1 machine, from a terminal enter the command:
ssh -L 8889:win1.solar.pvt:5900 oweng@ovsa.njit.edu
Then from a new VPN client enter the hostname:
localhost:8889
DPP
To login to the DPP machine, from a terminal enter the command:
ssh -L 8890:dpp.solar.pvt:5900 oweng@ovsa.njit.edu
Then from a new terminal enter:
ssh -p 8900 user@localhost
Remote File Copy
To copy files using scp (SSH-COPY) through the above tunnels, use the command (this example for port 8888):
scp -P 8888 user@localhost:<path and file to copy> <file destination>
Local Login
If logging into a computer locally on site then the following procedures are used:
Helios
Open the Remmina Remote Desktop Client. Make sure VNC is selected at the top left. Type in:
helios:20000
and enter the password when prompted.
The Helios display should now be visible.
To access a helios terminal, from a new terminal window type:
ssh sched@helios
Pipeline
To log in to pipeline, from a terminal enter the command:
ssh user@pipeline
Win1
To log in to the win1 machine, from a new VPN client enter the hostname:
win1
DPP
To login to the DPP machine, from a terminal enter the command:
ssh user@dpp
Setting up Accounts for Remote Access
Administrators
Log in to the gate way machine and start a superuser prompt:
su
or
sudo su
Then issue the following commands:
useradd -m -s /bin/bash ''username''
usermod -a -G ''username'' ''username''
cd /home/''username''
mkdir .ssh
chown ''username'' .ssh
chmod 700 .ssh
Once the above commands have been entered, ask the user to send you the public ssh key. Once you have this issue the following commands:
echo "''public key''" > .ssh/authorized_keys
chmod 600 .ssh/authorized keys
Note that the public key will be be very long. There can be no new line in the key, and the key should start with 'ssh rsa'. The user should now be able to access the gateway machine.
Linux Users
You must generate a pair of ssh keys to be able to access the gateway machine. From a command prompt issue the following command:
ssh-keygen
This will generate a pair of keys in the .ssh folder. The id_rsa file is the private key. DO NOT SHARE YOUR PRIVATE KEY WITH ANYBODY!
The id_rsa.pub file is the public key. Email this key to Owen or Dale and they will had it to your account. Note that Tohbans will typically be using the guest account. You will be notified once your public key has been added to the authorized_keys file. You should then be able to login.
Repeat this process if you have more than one machine that you wish to log into.
Helios Displays
Schedule Window
The Schedule window shows the currently running schedule as shown below.

The left side of the window shows each of the scripts that is to be run. The orange bar shows the task that is currently being run.
The right side of the window shows each command that is to be run in the current script.
At the bottom of the window are a series of buttons. The STOP button will stop at the current script. Once stopped, the remaining buttons will become active. To restart the schedule click on the GO button.
Restarting the schedule window
If the schedule window has locked up then you will need to close it. Click on the X at the top right of the screen.
If this does not work then from a helios terminal type in the command:
ps -elf | grep "schedule"
An output similar to that below will be displayed:

Note down the PID for the /current/python/common/schedule.py program, marked in red. Note that the number will be different from the one in this example.
To terminate the program type:
kill -9 PID#
where PID# is the number obtained from the ps command.
If the schedule window gets closed (or you closed it), it will need to be restarted. Follow the procedure below.
From a helios terminal issue the the command:
screen -ls
This will list all of the available screens as shown below.

If the schedule is listed (marked in red below)

then issue the command:
screen -r schedule
to restore the current screen. Take a screen capture of the terminal window if there are any errors listed and send a copy to Owen or Dale.
If it is not listed then issue the command:
screen -S schedule
to start a new screen.
In either case once the screen is open change to the ~/Dropbox/PythonCode/Current directory:
cd ~/Dropbox/PythonCode/Current
Restart the schedule:
python /common/python/current/schedule.py &
Press <CRTL>AD to exit from screen.
For more information on the screen command see http://www.ovsa.njit.edu/wiki/index.php/Owen%27s_Notes#Screen_Command
Stateframe Display
The Stateframe display shows the current status of the system as shown below:

There are problems with any antennas or systems that are highlighted in red. Lines that are marked in yellow designate a warning, but may not be critical.
Lines marked in purple are collapsible sections. Clicking on them will expand or collapse the section.
The tabs near the top of the display bring up different sections and enable graphs to be plotted.
Note that the Log Stateframe box should be marked in blue. If there is a second Stateframe display running this box will be unmarked on the second display.
Restarting the Stateframe Display
If the stateframe window gets closed it will need to be restarted. Follow the procedure below.
From a helios terminal issue the the command:
screen -ls
This will list all of the available screens as shown below.
If the stateframe is listed (marked in red below)

then issue the command:
screen -r stateframe
to restore the current screen. Take a screen capture of the terminal window if there are any errors listed and send a copy to Owen or Dale.
In either case once the screen is open change to the ~/Dropbox/PythonCode/Current directory:
cd ~/Dropbox/PythonCode/Current
Restart the stateframe display:
python /common/python/current/sf_display.py &
Press <CRTL>AD to exit from screen.
Note that it will take several minutes for the display to come up.
For more information on the screen command see http://www.ovsa.njit.edu/wiki/index.php/Owen%27s_Notes#Screen_Command
Computer Restart
Helios
To restart Helios, at a terminal enter the command
sudo reboot now
and wait about 5 minutes for it to restart.
Open a terminal and start the dropbox server:
python /home/sched/Downloads/dropbox.py start
Important: Check to see if the time service is running. Enter the command:
chronyc sourcestats
If nothing is displayed, then the time service will need to be started by typing:
sudo systemctl restart chrony.service
Start the x11vnc server by typing:
x11go
Copy the acc0time.txt file to /tmp as follows:
cp /home/sched/Dropbox/PythonCode/Current/acc0time.txt /tmp/
Start the schedule as described here: http://www.ovsa.njit.edu/wiki/index.php/Owen%27s_Notes#Starting_the_schedule_window
Start the Stateframe display as follows as described here: http://www.ovsa.njit.edu/wiki/index.php/Owen%27s_Notes#Restarting_the_Stateframe_Display
Open up a new terminal tab and log into the DPP by typing:
ssh user@dpp
Now issue the command:
ls /data1/IDB | tail 10
Open up a new terminal tab and log into the DPP as above. View the SMP_AFFINITY.sh by typing the command:
cat /home/user/test_svn/shell_scripts/SMP_AFFINITY.sh
Note down the two CPU's that are in use. Issue the following commands:
ipython --pylab
import dpp_plot_packets as dpp
dpp.fix_packets(cpu = [cpu1, cpu2])
where cpu1 and cpu2 are the CPUs that were noted down earlier.
DPP
Tohbans contact Owen or Dale to reboot the DPP!
First, check that the 10 Gb ethernet interfaces are present, by typing the command:
ifconfig
which should show a list of interfaces including enp5s0 and enp7s0. If these are NOT present, type:
sudo modprobe myri10ge
to start the device driver. Then check again that these interfaces are present.
Starting adc_plot
The adc_plot program will need to be restarted. To do this enter the command:
/bin/bash /home/user/test_svn/shell_scripts/adc_plot.sh > /dev/null &
Resetting the Interrupt Priority
The interrupt priority is now automatically reconfigured at startup. There is a 1 minute delay to allow drives to mount and other programs to load prior to the dpp_fix_packets.py program running. Output from the program can be viewed by accessing a DPP terminal and entering the command:
screen -r fixpackets
Significant information is also displayed on the stateframe display on Helios.
Start Data Recording
To start data recording enter:
rmlock
Mounting the dppdata1 disk
Note also that if the DPP reboots it is likely necessary to mount its disk on Pipeline, otherwise the pipeline task will fail. To check, log in to Pipeline and type df. The dppdata1 disk should be present. If it isn't, issue the command from pipeline:
sudo mount -a
ACC
Rebooting the ACC
To reboot the ACC, you will need to cycle the power. Follow the instructions below.
- From a web browser, goto the http://pdudigital.solar.pvt page.
- Click on the Action button shown below.

- Then click on Loads.

- Click on Item 14 - ACC (Array Control Computer)

- Click on Cycle and then OK when prompted

Restarting the ACC software from windows
To bring the ACC back to operation, it needs to be reloaded from windows as detailed below.
From the Windows machine, click on Start and then NI LabVIEW 2015 SP1 and finally EOVSA-LabVIEW 2015.lvproj. Then from the Project Explorer Window click on Targets ==> acc to expand the acc items. Then right click on acc and then click on Connect.


Now click on Startup => ACC Master.vi to open up the ACC Master VI window.Click on the white arrow at the top left of the window.


You should see a series of "NO ERROR" messages scrolling in the Initialization Messages window.

Finally, from the project explorer window, right click on acc and then click on Disconnect. The ACC Master window can now be closed.

Pausing and Adjusting the Schedule
Pausing the Schedule
Occasionally, it may be necessary to pause the schedule. Typically this will need to be done when a flare is in a progress (check here: http://ovsa.njit.edu/flaremon/XSP_latest.png), and observations need to continue. i.e you will not want to move to a calibration. To do this, simply click on Stop on the schedule window. The array will continue to observe the Sun until you click on go again.
Adjusting the Schedule
At times it will be necessary to adjust the schedule, especially if it has been paused or a calibration missed (especially the skycaltest). To adjust the schedule follow the following steps:
If the schedule is not stopped click on stop.

Click the items to adjust. These will be highlighted in grey.

Select the time increment from the top of the schedule and press the up or down keys to adjust the scheduled time.

Once done, click on Go to resume the schedule. <
Removing an Item from the Schedule
Occasionally, an item will need to be removed from the schedule, particularly if maintenance is being performed. To remove an item follow the procedure below.
Click on Stop to stop the schedule.
From the menu bar Click on File and then Save

Once the save dialogue box appears, just click on Save.

Using a text editor open the file /home/sched/Dropbox/PythonCode/Current/solar.scd. You should see the same list as in the schedule. An example is shown below.
2021-03-29 10:06:58 ACQUIRE 1229+020
2021-03-29 10:07:58 LOSELECT
2021-03-29 10:10:58 PHASECAL_LO 1229+020 pcal_lo.fsq
2021-03-29 10:30:58 HISELECT
2021-03-29 10:31:58 PHASECAL 1229+020 pcal_hi-all.fsq
2021-03-29 11:31:58 STOW
2021-03-29 14:37:00 SUN
2021-03-29 15:10:00 ACQUIRE 2253+161
2021-03-29 15:14:00 PHASECAL 2253+161 pcal_hi-all.fsq
2021-03-29 15:40:00 PHASECAL 2253+161 solar.fsq
2021-03-29 15:41:00 SKYCALTEST 2253+161
2021-03-29 15:45:00 SUN
2021-03-29 17:00:00 GAINCALTEST
2021-03-29 17:03:00 SUN
2021-03-29 18:30:00 SOLPNTCAL solar.fsq solpnt.trj
2021-03-29 18:35:00 SUN
2021-03-29 19:50:00 ACQUIRE 2253+161
2021-03-29 19:54:00 PHASECAL 2253+161 pcal_hi-all.fsq
2021-03-29 20:25:00 SUN
2021-03-29 21:30:00 SOLPNTCAL solar.fsq solpnt.trj
2021-03-29 21:35:00 SUN
2021-03-30 00:10:00 ACQUIRE 0319+415
2021-03-30 00:14:00 PHASECAL 0319+415 pcal_hi-all.fsq
2021-03-30 00:45:00 SUN
2021-03-30 01:18:00 STOW
2021-03-30 04:12:55 ACQUIRE 1229+020
2021-03-30 04:13:55 LOSELECT
2021-03-30 04:16:55 PHASECAL_LO 1229+020 pcal_lo.fsq
2021-03-30 04:36:55 HISELECT
2021-03-30 04:37:55 PHASECAL 1229+020 pcal_hi-all.fsq
2021-03-30 05:37:55 STOW
Remove any lines that you need to and then save the file, overwriting the existing solar.scd file.
From the Schedule click on File and then Open and select the solar.scd file.
Once loaded click Go on the schedule to restart it.
Note that clicking Today on the schedule will overwrite any changes!
Viewing Schedules for any Date
A schedule can be viewed for any date using the procedure below.
- Ensure you are logged into a helios terminal and in the Dropbox/PythonCode/Current directory.
- Access ipython:
ipython --pylab
- Enter the following commands:
import whenup from util import Time</span> whenup.make_sched(t=Time('yyyy-mm-dd'))
- where yyyy is the year, mm is the month and dd is the day. For example to view the schedule for 2021-08-26 you would enter:
whenup.make_sched(t=Time('2021-08-26'))
- The output of this command is given below:
['2021-08-26 11:14:02 ACQUIRE 0319+415',
 '2021-08-26 11:15:02 LOSELECT',
 '2021-08-26 11:18:02 PHASECAL_LO 0319+415 pcal_lo.fsq',
 '2021-08-26 11:38:02 HISELECT',
 '2021-08-26 11:39:02 PHASECAL 0319+415 pcal_hi-all.fsq',
 '2021-08-26 12:39:02 STOW',
 '2021-08-26 14:14:00 SUN',
 '2021-08-26 15:10:00 ACQUIRE 0319+415',
 '2021-08-26 15:14:00 PHASECAL 0319+415 pcal_hi-all.fsq',
 '2021-08-26 15:40:00 PHASECAL 0319+415 solar.fsq',
 '2021-08-26 15:41:00 SKYCALTEST 0319+415',
 '2021-08-26 15:45:00 SUN',
 '2021-08-26 17:00:00 GAINCALTEST',
 '2021-08-26 17:03:00 SUN',
 '2021-08-26 18:30:00 SOLPNTCAL solar.fsq solpnt.trj',
 '2021-08-26 18:35:00 SUN',
 '2021-08-26 19:50:00 ACQUIRE 1229+020',
 '2021-08-26 19:54:00 PHASECAL 1229+020 pcal_hi-all.fsq',
 '2021-08-26 20:25:00 SUN',
 '2021-08-26 21:30:00 SOLPNTCAL solar.fsq solpnt.trj',
 '2021-08-26 21:35:00 SUN',
 '2021-08-27 00:10:00 ACQUIRE 1229+020',
 '2021-08-27 00:14:00 PHASECAL 1229+020 pcal_hi-all.fsq',
 '2021-08-27 00:45:00 SUN',
 '2021-08-27 01:36:00 STOW',
 '2021-08-27 04:50:02 ACQUIRE 2253+161',
 '2021-08-27 04:51:02 LOSELECT',
 '2021-08-27 04:54:02 PHASECAL_LO 2253+161 pcal_lo.fsq',
 '2021-08-27 05:14:02 HISELECT',
 '2021-08-27 05:15:02 PHASECAL 2253+161 pcal_hi-all.fsq',
 '2021-08-27 06:15:02 STOW']
If needed, this can be copied and pasted into the solar.scd file. This is especially useful if the schedule needs to be restarted towards the end of the day. In this case (depending on time of year), the schedule program may load the schedule for the following day. If this occurs and you want to resume the schedule, use whenup with the previous days date and copy the output into the solar.scd file. Make sure you remove all leading spaces, brackets, commas and quotes. Save the file and load the solar.scd from the schedule and click GO.
Checking the adc_plot.py Program
The adc_plot.py program controls the backend gains. This must remain running. To check if it running follow the following procedure:
- From the DPP, issue the command:
ls /tmp/*.npy | tail
- The list of files will be of the form ADCplotYYYYMMDD_HHMM.npy. The most recent date should be the current day's date.
- If the file is not current then issue the command:
ps -elf | grep adc
- The output of this command should look similar to:
0 S user     18108 23862  0  80   0 -  2900 wait   20:56 pts/2    00:00:00 /bin/bash /home/user/test_svn/shell_scripts/adc_plot.sh
0 S user     18109 18108 35  80   0 - 708344 poll_s 20:56 pts/2   00:21:57 /common/anaconda2/bin/python /common/python/current/adc_plot.py
1 S user     26081     1  0  80   0 -  7607 poll_s Mar30 ?        00:00:00 SCREEN -S adc_plot
0 S user     27917 18481  0  80   0 -  3285 pipe_w 21:57 pts/6    00:00:00 grep --color=auto adc
- If /common/anaconda2/bin/python /common/python/current/adc_plot.py is at the end of the line and the .npy file for the current day is NOT present then issue the command:
kill -9 #####</span>
- where ##### is the PID, column 4 of the output above.
- Then issue the command:
- <pre style="font-family:courier">/bin/bash /home/user/test_svn/shell_scripts/adc_plot.sh
- Wait about a minute and then run
- ls /tmp/*.npy | tail
- and ensure there is a .npy file for the current day.
Calibrations
Reference Calibration
Before a phase calibration can be done, a reference calibration needs to be performed, which will be subsequently used as the reference for the phase calibration.
Either access Helios via VNC computer or login to pipeline. If using helios access a pipeline terminal.
At the prompt type the following command:
python /common/python/current/calwidget.py
The following window will open up:

In the date box near top right of the window type in or use the up and down arrows to select the previous days date and hit enter.
Click on the first available scan that does not suffer from a Windscram. Windscrams are marked in red. If a windscram occurred for less than 20% of the scan then it will be marked in yellow and may still be usable. The example below shows a windscram at 22:14:05.

Select the earliest calibration that does not have a windscram, and then click on 'Analyze as Refcal'. The Sigma map should now be populated as shown below:

The above chart is for the low-band (channels 1 to 12). Yellow blocks indicate bad or unavailable data. Bands 3 and 4 are excluded due to intense RFI at these frequencies. Antenna 5 currently is not operating well, and will be excluded from any analysis. The green blocks indicate that the data may be alright if some points are excluded. Purple blocks indicate the data is good.
Also shown in the above plot is the power and phase for Antenna 1 and band 12. The blue points are the X-polarization and the orange points are the Y-polarization. These should be close to straight lines.
In this case we need to exclude all of Antenna 5 from the calibration. First click on any block for antenna 5 in the range of band 1 to 12. Next check the box 'Apply to all bands'. Move the mouse over to either the Power or Phase plots (either works). We need to exclude all points. Move the mouse slightly before the first point in the chosen plot and press the 'A' key. A green line will appear. next move the mouse slightly past the last point and press the 'B' key. A red line will appear. The screen should look like the figure below.

Now click on 'Apply time flagging. All of antenna 5's bands should turn yellow.
Once complete, select the associated high band calibration and then click on 'Analyse as refcal'. In this case bands 7 to 52 will be shown on the sigma map as shown in the figure below.

Antenna 5 once again needs to be excluded using the procedure described above. In addition antenna 13 has problems from band 13 to 52. We will remove these channels from the analysis. Ensure 'Apply to all bands is unchecked and select 'Apply to all bands above selected one'. Select band 13. As before select all of the points by pressing 'a' and 'b' at the appropriate points (start and end of the plot). Click on 'Apply Time Flagging'. All of the bands from the selected band up should turn yellow as shown in the figure below.

As can be seen, there are still 3 green squares. We can make these good by selecting each one and flagging bad samples. In this example I have selected Antenna 4, Band 23.
Ensure all checkboxes are unchecked. Slelect the box for the antenna and band the you wish to time flag. select (using mouse and a and b keys) up to two ranges of points to exclude. pressing the x key will remove the most resent line chosen. Once you have flagged the ranges, click on 'Apply Time Flagging'. Hopefully the box will turn purple. If not you may need to select different ranges.
The result of this procedure is shown below.

Repeat this procedure for the remaining bad antennas and bands.
Once completed, select one of the bands of the refcals from list on the left and then click on 'Set as Refcal'. The click on extend selection. NOw select the other refcal. Make sure both are highlighted. Click on 'Set as extended refcal'. Click on 'Save to SQL'.
Phase Calibration
After the reference calibration has been done, the phase calibration can be performed. Click on a good calibration for the high band (one that has not had a windscram and has a reasonable duration). Not that Phase Cals are not performed using the low band.
Then click on 'Analyze as Phasecal'. At the top of the screen click on the 'Sum Pha' tab. The important thing here is that the slopes look good. Below is an example display of the slopes. These slopes are with reference to the Refcal.

In the above display, we can see that all of the slopes look good except for Antenna 4. note that we have excluded Antenna 5 from the observations as these have no reference cal. By moving the mouse over points on antenna 4 the channel is displayed as the x value in the bottom right of the window. In this case, channel 24 and above will be excluded. Ensure 'Apply to all bands above selected one' is checked and click on the antenna 4 and channel 24 box. Select all points and click on 'Apply time flagging' Once done, click on the 'Sum Pha' tab again to ensure the slope now looks okay (See figure below). Once satisfied click on 'Save to SQL'.

Note that source 1331+305 is a weak source, but at some times of the year it is the only one available. In this case there will be a lot of noise in the phase calibration. However it should still be usuable. Typically though, bands 40 and above will be need to be excluded.
Phase Cal has not been Processed
Occasionally the pipeline processing will not run properly. This may cause the phase data to no be processed properly. This will be indicated by strange durations on the phase cal window.
Log in to pipeline and issue the command:
cat /data1/processing/LOG/udb_process_log.txt_''yyyymmdd'' | tail
where yyyymmdd is the year month and day of the calibration data.
If more than 5 lines similar to the output shown below are present, then the lock file will need to be removed.
Fri Jan 22 15:35:01 2021 /data1/processing/udb_process.lock  Exists, returning
Fri Jan 22 15:40:02 2021 /data1/processing/udb_process.lock  Exists, returning
Fri Jan 22 15:45:02 2021 /data1/processing/udb_process.lock  Exists, returning
Fri Jan 22 15:50:02 2021 /data1/processing/udb_process.lock  Exists, returning
Fri Jan 22 15:55:02 2021 /data1/processing/udb_process.lock  Exists, returning
Fri Jan 22 16:00:02 2021 /data1/processing/udb_process.lock  Exists, returning
Fri Jan 22 16:05:02 2021 /data1/processing/udb_process.lock  Exists, returning
Fri Jan 22 16:10:01 2021 /data1/processing/udb_process.lock  Exists, returning
Fri Jan 22 16:15:02 2021 /data1/processing/udb_process.lock  Exists, returning
Fri Jan 22 16:20:02 2021 /data1/processing/udb_process.lock  Exists, returning
To remove the lock file simply type:
rmlock
Processing should then resume.
Adjusting the Schedule for Missed Calibration
If at the start of the day the schedule had locked up and part of the calibration has been missed, it is possible to adjust the schedule so that the calibration is still performed by following the procedure below.
- Stop the schedule by clicking on the STOP button on the schedule.
- While holding down the shift key select the first 5 items in the schedule (ACQUIRE, LOSELECT, PHASECAL_LO, HISELECT, PHASECAL).
- Ensure that M (for minutes) near the top of the schedule is selected. Click the +1 button near bottom of the schedule so that the Acquire time is 1 or two minutes after the current time.
- Then, if required, select either STOW or SUN and adjust the time so that the Phasecal after HiSelect runs for at least 20 minutes. Note that you can find if a source is still visible by using the whatup program ( http://www.ovsa.njit.edu/wiki/index.php/Owen%27s_Notes#Whatup_Program ).
- Click GO on the schedule.
System Gain Calibration
This procedure is designed to adjust the system gains. This should be performed weekly or whenever the calibrations become poor. The full details can be found at EOVSA System Gain Calibration. The steps below are a summary of that page.
The best time to perform this calibration is immediately after a Solar Point Calibration, as the antennas need to be taken off the sun.
The dBm values in the power and attenuation section of the Stateframe display should be between 1 and 4.
Initially click on the Stop button in the schedule window.
From the Schedule window issue the following commands:
$scan-stop
stow
femauto-off
femattn 0
$fem-init
Wait approximately 1 minute for the new settings to update. The frontend power levels should be between 1-4 dBm. If they aren't then reissue the $fem-init command
Then proceed with:
$subarray1 ant1-14
dcmauto-off ant1-14
fseq-file solar.fsq
fseq-on
$capture-1s dcm
Click on the Clear button and then the Go button.
From a pipeline terminal issue the following commands
ipython --pylab
import roachcal
tbl=roachcal.DCM_calnew('/dppdata1/PRT/PRTyyyymmddhhmmssdcm.dat',dcmattn=10,missing='ant15')
In the above command yyyymmddhhmmss is the year, month, day, hour minute and second of the dcm file. Pressing tab will complete the filename. for the missing field, antenna 15 must be included. Add any other antennas that are not to be included on the gain calibration separated by spaces.
Enter
tbl
to view the contents of the tbl variable that was just created.
Band 1 has recently had bad attenuations. To use older good values for this band issue the command:
tbl = roachcal.override(tbl, bandlist=[1])
Other bands can be excluded by adding the bands to the bandlist (space separated).
It is useful to compare the new table with an existing table to check for errors/glitches. To do this issue the command:
roachcal.compare_tbl(tbl, t=Time('2020-05-08'))
Replace the time with the previous days gain calibration. All of the differences should be close to zero.
Finally:
import cal_header
cal_header.dcm_master_tablesql(tbl)
From the Schedule window click the Stop button and then the Go button.
In the schedule command box enter the command
$scan-start
Frontend Benchtest
The Benchtest is performed whenever components are replaced in the receiver. For a description of how to service the receiver see [[1]].
Setup
Connect the power meter to the receiver as described here [2].
Find the GPIB cable and connect it to the ACC. Run the cable into the lab and connect it to the power meter.


Performing the Calibration
Access the windows (win1) computer.
From the Quicklaunch menu select the E4418B Measurement program.

This should bring up a screen as shown below:

Change Enum to the appropriate antenna number.
Change Reading to the appropriate polarisation.
From the Helios computer open up the gedit program.
Open the file /home/sched/Dropbox/PythonCode/Current/FEMbenchtest.scd
Edit the first line so that the correct antenna is present. For example, if antenna 5 is to be calibrated then the first line should read similar to:
1 2019-11-08 12:07:00 FEMBENCHTEST ant5
Once edited, save and close the file.
On the Schedule window click on Stop.
Click on File and then Open

Select the /home/sched/Dropbox/PythonCode/Current/FEMbenchtest.scd file and open it.
Click on Today
From the Window computer, on the E4418B program click on Start Logging Data
The computer should go through four sequences which display 4 block patterns on the plots in the E4418B program.
Once completed click on Stop
Repeat for the other polarisation if required.
Remember to reload and restart the Solar.scd schedule.
Loading the Calibration to the CRIO
The files created are located in the Dropbox/EOVSA M&C/Test Data/ folder.
Find the most recently created text files and open the first of them in a text editor. An example of a part of the file is shown below:

This file need to be edited to remove all but one of the 5 lines for each attenuation. Typically choose the third entry in each data block.
Once the file has been edited and saved, from pipeline change to the folder where the edited files are located.
From ipython, enter the following commands:
import fem_cal as fc
import crio
fc.fem_cal(ant
where ant is the antenna number for the particular calibration.
The latest files for that antenna will be read, and a plot will appear for each polarization with both points and quintic fit. The parameters of the fits will be printed to the screen in a form that can be cut and pasted directly into the crio.ini file for the appropriate antenna
To retrieve the crio.ini file for a given antenna issue the following command in ipython:
crio.save_crio_ini(ant_str='ant#')
where # is the antenna number. Press CRTL Z to exit ipython temporarily.
Open the downloaded ini file in a text editor and copy the new coefficients into this file. Enter fg to get back into ipython.
Finally enter the command
crio.reload_crio_ini(ant_str='ant#')
Update Antenna Pointing
2m Antenna
Access the Pipeline Computer.
From the terminal, start ipython:
ipython --pylab
Import the solpnt_x and Time libraries:
import solpnt_x as sx
from util import Time
Load up the solar pointing scans for a given date and time.
tsolpnt = Time('yyyy-mm-dd HH:MM:SS')
solout = sx.solpnt_xanal(tsolpnt)
To view the beam widths as a function of frequency for each antenna and polarisation:
sx.solpnt_bsize(solout)

To obtain the pointing offsets:
offsets = sx.solpnt_offsets(solout)
This will display the current pointing positions of each antenna. Ideally each antenna should be pointing at the center of the disk. If particular antennas significantly deviate from the center then a correction can be made.


For example, the following command will adjust the pointing offsets for antennas 6 to 8, 10 and 13:
sx.offsets2ants(offsets, ant_str='ant6 ant7 ant8 ant10 ant13')
The newer antennas with the alt-az drives that have had tracking updated will need to be rebooted. From the Schedule Window issue the commands:
reboot 1 ant6-8
tracktable sun_tab.radec 1 ant6-8 track ant6-8
The antenna pointing adjustment is typically performed once per month.
Manually Changing Coefficients
Sometimes an antenna's pointing coefficients will be so far off that a normal pointing calibrations will not work. The coefficients can be reset to an earlier value by using the following procedure.
From a helios terminal enter the following commands:
ipython --pylab
from util import Time
import dbutil as db
trange = Time([datestr1,datestr2]).lv.astype(int)
query = 'select Timestamp,Ante_Cont_PointingCoefficient1,Ante_Cont_PointingCoefficient7 from fV66_vD15 where I15 = # and (cast(Timestamp as bigint) % 86400) = 100 and Timestamp between ' + str(trange[0]) + ' and ' + str(trange[1]) + ' order by Timestamp'
data, msg = db.do_query(cursor,query)
n = len(data['Timestamp'])
for i in range(n):
    print Time(data['Timestamp'][i],format='lv').iso,data['Ante_Cont_PointingCoefficient1'][i],data['Ante_Cont_PointingCoefficient7'][i]
Here datestr1 and datestr is the range of times that are to be searched in the form yyyy-mm-dd HH:MM and # is the antenna number-1
The above code will display a list of pointing coefficients. Select a suitable pair and then from the schedule issue the commands:
pointingcoefficient1 xxx ant#
pointingcoefficient7 xxx ant#
where xxx are the new pointing coefficients and :# is the antenna number.
Star Pointing for the 2m Antennas
Occassionaly, the normal 2m antenna pointing calibration will not work as this only adjusts 2 of the 9 antenna parameters. A more rigorous technique by taking images of stars can be performed.
To begin with an optical telescope must be attached to the side of the dish that needs adjustment. The telescope and camera will need to be shipped from NJIT. Find the mounting bracket and attach this to the dish and then attach the telescope to the bracket as shown in the figures below.


Next the telescope needs to be aligned. It does not need to be perfect, but does need to be reasonable close. Ensure the antenna is tracking the sun. Hold your hand below the telescope, beyond the focal point. DO NOT PLACE YOUR HAND AT THE FOCUS AS YOU MAY GET BURNT!
You should see a bright disk surrounded by a dark ring. The disk should be centered and the ring should be a uniform size. Adjust the alignment of the telescope, by tightening and loosening the bolts on the mounting bracket.
From a helios terminal change to the /Dropbox/PythonCode/Star\ Pointing folder.
Enter the following commands:
ipython --pylab
import readbsc as rb
rb.do_stars(Y,M,D,h,m,npts=n)
where Y,M,D,h,m are the year, month, day, hour, minute and second of the start of the observations, and npts is the number of points to observe (you will probably need about 50).
Note that it is a good idea to set the start time well after dark. As soon as you start the appropriate scd file, the antenna will go immediately to the first source.
Enter cd ../Current to change to the Current folder.
Enter nano STARS.ctl to edit this file. You should see text similar to:
$SCAN-STOP
SUBARRAY1 ant7
TRACKTABLE startracktable.radec
TRACK
Change the antenna number to the antenna that the telescope is attached to. Press [CRTL X] to exit and press [Y] to save the file.
Enter nano starpointing.scd to edit the starpointing.scd file (example below).
2021-05-30 03:30:00 STARS
2021-05-30 09:30:00 REWIND
Change the date to the date at which you want to start observations. Press [CRTL X] to exit and press [Y] to save the file.
From the windows laptop find the kjell-lap/Dropbox/PythonCode/Star Pointing folder. Create a folder with date that the observations will be taken in the form yyyy-mm-dd.
Double click on the ASIImg Icon. On the right, scroll down to find the path where the images are to be stored. Click on the folder icon and then select the folder you just created.
Once the last phasecal of the day has been completed, go outside to the antenna where the telescope is connected with the laptop and a small table. Connect the laptop using an extension cord to the power point and connect the camera to one of the USB ports on the laptop. Remove the lens cap from the telescope and move the focus to the mark on the telescope.
If it is not already open double click on the ASIImg icon.
![]()
This will bring up the window shown below. Within this window click on the ASIImg Icon.
![]()
This will bring up the capture window as shown below. The controls for the camera are on the right of the window.

Scroll down a little on the control section until you find the Path. Click on the folder Icon (marked in red).

In the file dialog box, ensure that you are in the Dropbox/PythonCode/Star Pointing folder. Right click on the file dialog window and select New and then Folder. Enter a folder name in the form of yyyy-mm-dd , using the current UT days's date.

Scroll back up and click on the small red play arrow (marked in the red box below) to connect to the camera.

Click on the preview button if it is not already highlighted.

Set the Exposure time. Initially, if there is still some light set it to 1 second, as it darkens you can increase the exposure time gradually up to 10 seconds.

Select on continuous.

Click on the large play button. This will change to a stop button.The camera status bar at the bottom should continually update. If it hangs click the stop button and then click the play button again.


By scrolling down on the right, you will be able to see a histogram. In addition, in the left pane you will be able to see the most recently captured image. As it gets dark carefully adjust the focus so that the stars are as focused as possible. Once this is done, place the lens cap on the end of the telescope.
Stop the camera from previewing by clicking the stop button.
To take dark frames, click Capture, and then Auto Run.


A new window will open up as shown below:

Click on the tab below Ordinal and select Dark. Click on the arrow below the Exposure tab and select 10. Click on Frames and change this to 10.


Click on Start. When prompted to Enable Cooler, click No.


Once done, remove the lens cap from the telescope. You can now go inside and log into the laptop via VNC (IP Address: 192.168.24.184:0, the password is the same as for Helios).
Once logged in click on the Reset Button.

Now change the Ordinal to Light and set the Frames to 1100
From the Schedule click on File and then Open. Select the starpointing.scd file and then click on GO.
Once the start time of the has been reached, you can click Start on the ASIImg capture window and select No when it prompts to enable cooling. You can now close down the capture Window.
It will now automatically capture images.
Once observing has finished and before the antenna moves to the sun remove the telescope from the antenna or place the lens cap on the end of the telescope, or place the antenna in Stow and power off the antenna controller (new antennas) or CRIO (old antennas) at the Viking Unit. DO NOT ALLOW THE TELESCOPE TO POINT AT THE SUN WITHOUT THE LENS CAP ON!
Bring in the telescope, laptop, cables and camera to the EOVSA building.
Reconnect the windows laptop and then select from the Quickstart menu select MaxIm DL 5.

From the Process Menu, select Set Calibration.

Click on the Folder Icon.

Select the folder with the dark frames. This will be under the folder you created earlier, and should be the first of two folders. Once Selected, Click OK.


27m Antenna
Only do this if absolutely required. The 27m pointing should only need to be performed at most on an annual basis. It takes 24 hours to complete. If possible, schedule the pointing when there are few active regions on the sun
From a helios terminal, view the calpnt48.scd file by issuing the command:
cat /home/sched/Dropbox/PythonCode/Current/calpnt48.scd
Below are the first few lines of this file:
2019-06-22 10:26:00 ACQUIRE 2136+006
2019-06-22 10:30:00 CALPNTCAL 2136+006 band21.fsq calpnt.trj
2019-06-22 10:55:00 ACQUIRE 2253+161
2019-06-22 10:59:00 CALPNTCAL 2253+161 band21.fsq calpnt.trj
2019-06-22 11:24:00 ACQUIRE 2136+006
2019-06-22 11:28:00 CALPNTCAL 2136+006 band21.fsq calpnt.trj
2019-06-22 11:53:00 ACQUIRE 2253+161
2019-06-22 11:57:00 CALPNTCAL 2253+161 band21.fsq calpnt.trj
The dates and times need to be edited. Use the following equation to compute the new times:
OFFSET = NST - OST
NT = OT + OFFSET
where NST is the sidereal time when you wish to start the calibration, OST is the sidereal time for the first entry in the calpnt48.scd file, NT is a new UT time in the schedule, and OT is the old UT time in the schedule.
The /home/sched/Dropbox/PythonCode/Current/update_calpnt48.py file contains a function that will automatically create a new calpnt48.scd file. To use it issue the following commands from a Helios terminal:
cd /home/sched/Dropbox/PythonCode/Current/
ipython --pylab</p>
from util import Time</p>
import update_calpnt48 as ucp
ucp.update_calpnt48(t2 = Time("yyyy-mm-dd hh:mm"))
where yyyy-mm-dd hh:mm is the approximate UT start date and time for the calibration. If the time is omitted then the current time will be used.
This program will overwrite the calpnt48.scd file. The previous file will be saved as calpnt48.scd.bak
Sources will be replaced if they are outside the following ranges:
HA: -55 to +55 degrees
Alt: Greater than +10 degrees
Az: 35 to 325 degrees
A sample screen output of the program is shown below:

If you just want to see the screen output without overwriting the existing calpnt48.scd file issue the command from ipython:
ucp.update_calpnt48(t2 = Time("yyyy-mm-dd hh:mm", overwrite=False))
Once run, type exit to exit ipython.
Load the new calpnt48.scd file into the schedule and start it. Let it run for about 24 hours.
Adjusting Antenna Delays
Note: Only perform this procedure if absolutely necessary! This should be done either after the evening calibration or before the morning calibration.
Using the Delay Widget
From pipeline, start the delay widget as follows:
python /common/python/current/delay_widget.py
A window similar to the one shown below should appear:

At the top right, click on File and then Open npz file
Select the most recent file.
You will see a screen that looks similar to that below:

Note that if you had a file loaded and different antenna selected, the program will default to antenna 1 but not change the number in the Antenna box.
Select the antenna for which the delays are to be checked.
For the four panels on the left, each cluster of points represents a band. Each cluster in the XY and YX plots needs to be as flat as possible. Also the XX-YY plot on the right need to have all points as flat as possible. The slopes can be adjust by incrementing or decrementing the X delays on the left of the screen.
Repeat this process for any other antennas.
The following should be noted if adjusting the delays on antenna 1:
- Adjusting the delays on antenna 1 is essentially the same as adjusting the delays on antenna 14 as antenna 1 is used as a reference for the other antennas. If delays on antenna 1 are adjusted, they will need to be adjusted on all other antennas.
- You will also need to adjust the low frequency delays on antenna 1, but no other antennas.
Once done the new delays can be save from the File menu.
Only save the new delays if you are absolutely certain changes need to be made!
Click on Exit to close the application.
Checking that the delays were updated
To see if the delays were updated, perform the following procedure.
From pipeline access ipython:
ipython --pylab
Load the cal_header and and Time modules:
import cal_header as ch
from util import Time
We want to use the dla_censql2table function to create a table of the delays. This is done by:
ch.dla_cen2sqltable(t=Time('yyyy-mm-dd hh:mm'),acc=False)
where yyyy-mm-d hh:mm is the date and time for the last delays (it will look for the first time prior to that specified) and acc=False tells the function not to send values to the ACC.
For example to view delays from the 3rd of November 2020 (or the first date prior to this) you would issue the command:
ch.dla_cen2sqltable(Time('2020-11-01 01:00'),acc=False)
Note that this writes the data to a text file: /tmp/delay_centers.txt
To view this file issue the command:
!cat /tmp/delay_centers.txt
To view an older file, use the ch.dla_cen2sqltable with an earlier time and reissue the cat command. The delays that were changed should be different for the given antennas. Note that if antenna 1 delays were changed, this change will be shown in antenna 14.
Updating SQL Database on the Cloud
Note that you must have a .netrc file in your home on pipeline folder and the permissions set correctly for this to work
When running for the first time, add the following lines to your .bashrc file:
alias loadpyenv3.8='source /home/user/.setenv_pyenv38'
alias loadctl='source /home/user/.setenv_ctl'
To create new entries for the cloud data base, from your pipeline account run the following commands:
bash
loadctl
ipython
import eovsactl.sql2mysql as s2m
s2m.sync2mysql()
s2m.sqltable2mysql('abin',host='amazonaws.com')
s2m.sqltable2mysql('abin',host='localhost')
The commands above will create a .sql file at /data1/
To send it to the cloud type:
!mysql -h eovsa-db0.cgb0fabhwkos.us-west-2.rds.amazonaws.com -u admin -p eOVSA < /data1/yyyy-mm-dd.sql
The password is the last one in the .netrc file
To check if the file was sent to the cloud, use the python command:
s2m.get_latest_timestamp()
Reprocessing Pipeline Data
Occassionally, pipeline data will need to be reprocessed if it failed or there were bad calibrations.
Creating full disk images
Log in to a pipeline terminal and create a new screen:
screen -S fulldisk
Next run the following command:
/bin/bash /common/python/eovsapy/shellScript/pipeline.sh -c 1 yyyy mm dd > /tmp/test_pipeline.log
where yyyy is the year, mm is the month and dd is the day of the data to be processed.
This will take several hours to run. When completed run the command:
/bin/bash /common/python/eovsapy/shellScript/pipeline_plt.sh -c 1 -e 1 yyyy mm dd > /tmp/test_pipeline_plt.log
This should only take a few seconds to run.
Finally run the following command:
/bin/bash /common/python/eovsapy/shellScript/pipeline_compress.sh -n 1 -O 1 yyyy mm dd > /tmp/test_pipeline_compress.log
Note you can reprocess multiply days by running each day in a separate screen. Remember to assign a different name to each screen and assign a different name to each log file.
Total Power Calibration
To check if a total power calibration has been done on a particular day follow the steps below from a pipeline terminal
ipython --pylab
import cal_header as ch
from util import Time
from stateframe import extract
xml, buf = ch.read_cal(10, Time('yyyy-mm-dd 20:00'))
outtm = Time(extract(buf, xml['SQL_timestamp']), format='lv').iso
Time(extract(buf, xml['SQL_timestamp']), format='lv').iso
outtm
where yyyy is the year, mm is the month, dd is the day.
The return time should be 20:00 on the date specified. If not then copy the record to the correct time as follows:
ch.copy_cal(10,Time(outtm),Time('yyyy-mm-dd 20:00'))
To rerun the Total Power calibration, exit ipython and enter the command:
/bin/tcsh /home/user/test_svn/shell_scripts/pipeline_allday_fits.csh --clearcache 2023 10 16 > /tmp/test_pipeline_fits.log
Trouble Shooting
General Problems
Temperature Controller
Occassionally a front end temperature will show an error. This is usually because the temperature controller that reports the temperature has locked up. To fix this type the following command in the Schedule window:
tec$bc ant#
where # is the antenna number that needs the temperature controller rebooted.
To clear the temperature error history (that updates every minute) issue the command:
tec$sc ant#
If the above steps do not work, the following command can be issued:
$pcycle fem ant#
This will recycle power to the front end controller. If this does not work you can check the log file from a helios terminal by typing
tail -20 /tmp/schedule.log
A display similar to that below will be shown:
2020-08-17 13:56:03.002 Ant4 attempt #1 to login.
2020-08-17 13:56:03.002 Ant4 Login failed with status code: 401
2020-08-17 13:56:04.002 Ant4 attempt #2 to login.
2020-08-17 13:56:04.002 Ant4 Login successful.
2020-08-17 13:56:04.002 Ant4 Fronttend now off
2020-08-17 13:56:19.002 Ant4 attempt #1 to login.
2020-08-17 13:56:19.002 Ant4 Login successful.
2020-08-17 13:56:20.002 Ant4 Frontend now on
Note that the second line says that the login failed. It will attempt a login in three times. If this fails you can attempt a recycle to issue the command again. If this does not work the front end needs to be reset at the auxiliary box at the antenna. This is done by switching off the two breakers, waiting 10 seconds and then switching them back on. The breakers are shown below.

Packet Loss on DPP
The packet loss monitoring has now largely been automated. However it is still a good idea to check to make sure everything is running smoothly.
Details on the new programs and procedures can be found here: http://www.ovsa.njit.edu/wiki/index.php/Owen%27s_Notes#DPP_Fix_Packets_Details
Data Recording on the DPP has Stopped
To Check if the DPP is recording data, from a DPP terminal issue the command:
ls /data1/IDB |tail
This will display the last 10 IDB files that were created. They should have a time stamp about 10 minutes apart and the last file should only be 10 minutes or so old.
If current IDB files are not displayed then firstly check to see if The STATE is On in the phase tracking section of the stateframe is displayed as shown below.

If the state is off then simply click Stop on the schedule window and then click on Go. The state should return to On. Check to see if the DPP is creating files after about a minute.
If the DPP is still not recording data or the State was already on then follow the instruction below.
- Log in to the DPP computer (user@dpp).
- Enter top . A display similar to that below should be shown.

- Look for dppxmp under “command” column (shown here in the red box). If this is present not the PID# (shown here in the green box. Note that this number will change if dppxmp is restarted).
- Press 'q' to exit the top program
- If dppxmp is present issue the command:
kill pid#
- where PID# is the number noted down previously. This will stop the dppxmp program.
- Enter the command rmlock
- Check again to see if data recording has recovered
- Type “rmlock" on DPP terminal. Check if the data recording has recovered by sending ls /data1/IDB |tail
Restarting the Schedule
If the schedule needs to be restarted then follow the steps below:
- Click Stop and then Clear.
- Click Today and then Go.
Pipeline Problems
If there is no data showing at http://www.ovsa.njit.edu/browser/ then something has gone wrong with the pipeline processing. Below is a image of what the webpage looks like when an error has occurred.

Clicking on the Newest button will refresh the page and upload the latest data. If this does not correct the problem take a note of the date in the web address of the page. Then click on 'Today's Data'. A list of fits files should appear as below:

To check to see why the images are not visible, the log files can be inspected. Log on to pipeline and type the command:
crontab -l
The image below show a part of the output. The portion in the red box is the script that generates the full disk image.

To view the programs run by this script issue the command:
cat /common/python/suncasa/shellScript/pipeline_fdimg.bash
and an output similar to that below should be produced:

Note that the are three log files produced: /tmp/pipeline.log, /tmp/pipeline_plt.log and /tmp/pipeline_compress.log.
By inspecting these files you should be able to determine at what point an error occurred. To view these files type:
cat [logfile]
where [logfile] is the name of the logfile you wish to view.
Bad Front End Attenuation Values
The front end power values on both the horizontal and vertical channels should be between about +1 dBm and +4 dBm. These can be found on the stateframe display as shown below.

If the power deviates significantly from the 1 to 3 dBm range (unless there is a burst in progress or a gaincal test being performed) then the attenuations can be adjusted by issuing the following commands from the Schedule window:
hattn first second ant#
where first and second are the attenuations of the first and second attenuators for the horizontal polarization and ant# is the antenna number. Note that first should always be zero.
Similarly to adjust the vertical attenuators:
vattn first second ant#
Note that no warning will be shown if the power deviates significantly from the acceptable range.
Warning on Power and Attenuation
On the state frame display in the Power and Attenuation section, occasionally an antenna will turn yellow (warning). This will usually be because the 1st attenuator value is not zero. This will occur during a gaincaltest or a burst. The value should be even. If the value is 9, then the CRIO file will most likely need to be be reloaded.
Follow the instructions here http://www.ovsa.njit.edu/wiki/index.php/Owen%27s_Notes#Reloading_the_crio.ini_File to relaod the crio.ini file
Error on Power and Attenuation
On the state frame display in the Power and Attenuation section, occasionally an antenna will turn red (error). This may happen during a gaincal. However If it occurs outside a gancal and the Power values are reading nan (Not a Number), then it is possible that communications have been lost at the front end. You can try and cycle power to the front end by issuing the command from schedule:
$pcycle fem ant#
If the $pcycle command does not work you can try testing the network connection. From a helios terminal, issue the command:
ping ant#.solar.pvt
where # is the number of the antenna. If you get a message similar to:
From helios.solar.pvt (192.168.24.103) icmp_seq=1 Destination Host Unreachable
then it means that the communications are down. Contact Owen to reset the power at the antenna.
Resetting Attenuation Values
Occasionally, the front end attenuation values may get stuck, typically after a calibration. To reset the attenuations, use the following commands on the schedule:
femauto-off ant#
femattn 0 0 ant#
Schedule Commands not Working
If schedule commands are not working then the ACC may need to be restarted.
To determine if the ACC needs restarting issue a command from Schedule. At the top right of the Stateframe the 'Task' should be updated. if it is not then follow the following procedure:
- Go to the Windows computer and from the Quicklaunch menu select 'EOVSA E&C'.
- Once running click on 'Reset ACC' and wait about 10 seconds.
Queue Overflow Error
On the Stateframe display, a 'Queue Overflow' Error may occur under the Frequency Tuning bar. To correct this issue type the following command into the Raw Command box on the schedule:
lo1a-reboot
Stop and then restart the schedule.
Bright Scram
A bright scram occurs when the dish becomes more reflective, usually due to ice or water. This will cause more heat to be focused which can result in damage to the feed (burnt feed). A bright scram moves the dish 10 degrees off the Sun. It will the periodically move back to the Sun and remain tracking once the temperature at the feed drops sufficiently.
ONLY PERFORM THE PROCEDURE BELOW IF YOU ARE ABSOLUTELY SURE THAT A BRIGHT SCRAM IS FALSE AND REALLY NEEDS TO BE CLEARED. YOU RISK BURNING THE FEED!
A bright scram can be cleared by issuing the following command from the schedule:
bscram-clear ant#
If an antenna is performing brightscrams erroneously (for example during a phasecal), then an individual antenna can have the brightscram disabled by issuing the following command from the schedule:
bscram-off ant#
To re-enable brightscram on a particular antenna issue the command:
bscram-on ant#
Older Antennas Not Tracking
The older antennas (9-11 and 13) will occasionally seem to stop tracking. This is usually because it has lost where it is pointing. It will move incredibly slowly until it reaches its limit before returning to regular tracking. This process cant take up to about 20 minutes. If it has not resolved it tracking problems in this time, proceed with normal trouble shooting.
Antenna Trouble Shooting
If an antenna in the State-frame Antenna Tracking section is highlighted red, go through the following list.
Reloading the track table
Reload the track table as by issuing the following commands from the schedule
tracktable sun_tab.radec ant#
track ant#
Note that omitting the ant# will resend the commands to all antennas. You can specify more that on antenna.
Stowing the antennas
Attempt to stow the antenna by issuing:
stow ant#
If there are still errors, from the state-frame display, click on the antenna display and then click on the tab for the appropriate antenna.
Antenna at its limits (New Antennas)
If a limit is highlighted you will need to move the antenna from its limit. Firstly issue the command:
runmode 2 ant#
Issue the appropriate command according to the following table:
| Co-ord | Limit | Command |
|---|---|---|
| Azimuth | High | azimuthvelocity -5000 ant6 |
| Low | azimuthvelocity 5000 ant6 | |
| Elevation | High | elevationvelocity -5000 ant3 |
| Low | elevationvelocity 5000 ant6 |
Once the limit indicator goes green issue the command:
azimuthvelocity 0 ant#
or
elevationvelocity 0 ant#
Return the antenna to tracking:
track ant#
Antenna at its limits (Old Antennas)
Initially try to stow the antenna:
stow ant#
It may take a while for the antenna to stow.
If the antenna fails to stow, it will need to be manually driven off its limit as described here: http://www.ovsa.njit.edu/wiki/index.php/Owen%27s_Notes#Moving_the_Old_Antennas_Manually and then try to stow the antenna.
Once stowed, return the antenna to tracking:
track ant#
Bad values for antenna position
If any of the following is true:
- on antennas 1 to 8 or 12 the azimuth is outside the range of 0 to 360 degrees,
- on antennas 1 to 8 or 12 the elevation is outside the range of 0 to 90 degrees,
- on antennas 9 to 11 or 13 the hour angle is outside the range of -180 to 180 degrees,
- on antennas 9 to 11 or 13 the declination is outside the range of -90 to 90 degrees,
you can try to issue the following commands:
stop ant#
sync-motion ant#
The antenna should then go to its stow position. Once it is stowed send the commands:
tracktable sun_tab.radec ant#
<pre style="font-family:courier">track ant#
The antenna should resume tracking.
Rebooting the antenna
On the newer antennas (antennas 1 to 8 and 12), access the window computer, click on then Quick launch icon at bottom right and then click on the antenna that is problematic.

A screen window to that below will come up. Ensure that the Enable box at the lower right is checked.

One or both of the Permit boxes may be red.
Click on the Reboot Drives button. and wait about 10 seconds. The click on the Drives On Button. It should turn Green. Click on the Operate Button. If this does not turn green you may need to reboot the edge13b server.
Click Exit.
Rebooting the antenna interface on the edge13b server
Whenever an antenna link seems to be down (indicated by the lack of a blinking link light on the edge13b router), note the port that is down (The antenna is labelled on each fibre pair).

Refer to it as
fa0/#
where # is the number of the port. E.g., if port 1 is down, it will be referred to as fa0/1.
From Helios, telnet to the switch:
telnet edge13b.admin.pvt
Enter the the password when prompted.
Enter the command:
show inter fa0/1

The first line will show the status. If it is listed as Connected then nothing needs to be done. Enter:
quit
to exit from telnet
If the connection is listed as err-disabled then proceed with the following steps. At the telnet terminal issue the commands:
enable
and enter the password.
configure ter
interface fa0/#
where # is the port number.
shutdown
no shutdown
end
You can then reissue the show inter command to see if the interface is running. The port light should also be blinking on the server.
Issue then command
quit
to exit telnet.
Resetting antenna parameters
If the antenna still will not start goto the following webpage:
http://ant#.solar.pvt
Click Login and then enter the username and password.
Click Parameters and the change Option 10.00 to 1070 and Option 10.38 to 100. Click on change.
Then click on logout.
After the above procedures are completed you will need to reload the track table. This is done from the State Frame display using the following commands (again ensure that ant5 is replaced with the appropriate antenna):
tracktable pcal_tab.radec ant5
font-family:courier">track ant5
Antenna Communications Failure
If an antenna is highlighted in the Communications section of the State-Frame display then the following procedure can be used to correct it.
From the Schedule on Helios enter the command
$pcycle crio ant2
and wait about 2 minutes.
From the Schedule on Helios issue the command
sync ant#
for the newer antennas or
sync-motion ant#
for the older antennas where # is the antenna number.
If this does not resolve the communications problem, then proceed with the procedure below.
Access the win1 computer.
Click on Start then select NI Max.

Goto Remote Systems and then select the CRIO that is not communicating.

Click the System Settings tab at the bottom of the window. Status should be listed as Connected - Running

Click on Refresh to reconnect.
The CRIO will have an IP address in the range of 192.168.24.41 to 192.168.24.53. If it is not working this IP address will be strange. Click Restart.
From the Schedule on Helios issue the command
sync ant#
where # is the antenna number.
If the communications are still not restored, you will need open Labview.
If it is not already open, Click Start then NI Labview 2015.

The LabView start screen will appear after a few seconds.

Click on the Operate menu option and then select Debug Application or Shared Library.

Once the new window opens type in the name of the CRIO in the Machine Name or IP Address box. Then click Refresh. The file startup.rtexe should appear. Click on Connect.
Note that if a message similar to 'No debuggable application found' is displayed you may need to click on refresh several times. When it first reboots it will say it cannot find any debuggable applications, and then at some point it comes back with startup.exe. But if you wait too long it ends up in software safe mode (it will display "Safe Mode" next to Running) and you will need to click on "Restart" in the NI-Max program and click refresh on the Labview program until you see startup.exe, wait for a few seconds and then hit the button to load the debug software.

In the new window that opens check that the time is updating and that the time is correct an updating and that the Run index is updating. The Exec States should all be set to Run.

At the top of the screen click on the Stop Icon and then the Go icon (the arrow).
From the Schedule on Helios issue the command
sync ant#
or
sync-motion ant#
where # is the antenna number, depending on whether it is a new or old antenna.
To exit from the Debug session, right click on an empty part of the form which will bring up Remote Debugging. Click on this and then select Quit Debug Session.

If the above procedure has not worked, then from the debug session, right click on an empty part of the window and then click on Remote Debugging and then Show Block Diagram.

This will bring up the block diagram. Double click on the left bottom icon.
![]()
This brings up the cRIO antenna VI.

Click on the stop button. It should restart in a few seconds automatically. Close the opened windows except for the Debug session (click on an empty part of the form then Remote Debuggingthen Quit Debug Session).
If all else fails, restart the CRIO from the Viking unit.
Restarting the Viking Unit
The Viking units control power to the various systems (Antenna, Front End and CRIO). To recycle power to a particular system, goto the webpage
http://vik#.solar.pvt
where # is the antenna number. Enter the username and password. The following screen should appear:

Note that when the relays are off, power is being supplied to the indicated system. In the image above, all relays are off so each system is powered.
To recycle power to a particular system, click on the circle next to the system. If the circle was red initially, it will go green, and vice-versa. If you are turning the relay on then wait ten seconds before turning the relay off again. Ensure that the relay is Off (red) before logging out.
Ant 12 Cable Wrap
From time to time, Ant 12 may get past its limits and get into the wrong "turn." If this happens, the cables can be unwrapped using the hand controller, but doing that does not reset the "turn" indicator (parameter 20.17). After manually unwrapping in this way, go to the antenna web page (or the Ant12_ACI interface on the win1 machine) and check the value of parameter 20.17. If it says 2, it means it is on the wrong turn (should be 1). In that case, attempting to STOW or TRACK the antenna will only make it try to unwrap and end up stuck at the north limit. If this happens, manually move the antenna back to the south point with the hand controller, and then check the value of parameter 20.17. If it is not now 1, you may have moved the antenna in the wrong direction. Once it is back to 1, check the parameter 20.15, which is the encoder zero. Add or subtract 360 degrees to that value and set the 20.15 parameter to the new value. For example, on 8/17/2021, the encoder zero was -29, so we set it to 331. Next time it happens, we would probably set the value back to -29. In any case, after changing the parameter, the dish should STOW properly.
Receiver Trouble Shooting and Repair
Positioning the Antenna
If working on a newer antenna follow the instructions here: http://www.ovsa.njit.edu/wiki/index.php/Owen%27s_Notes#Moving_the_New_Antennas_Manually
If working on an older antenna follow the instructions here: http://www.ovsa.njit.edu/wiki/index.php/Owen%27s_Notes#Moving_the_Old_Antennas_Manually
Removing the Receiver
Switch off the power to the receiver at the auxiliary box by pulling down the two breakers.
Below is an image of the tools required for removing the receiver.

Whenever touching the receiver ensure that the Anti-static strap is worn and grounded!
Loosen the nuts on bolts that attach the receiver to the feed almost the entire way but leave them on the bolts. The feed can be pressed forward to give enough room to detach the SMA cables.

Carefully disconnect the SMA cables from the feed. Note the position of the horizontal and vertical polarisation cables.

Place caps on the end of the SMA cables.

Carefully remove all of the cables from the back of the receiver.

Place a cap on the fibre optic port and the fibre optic cable.


Remove the nuts entirely. Remove the 3 allen bolts.

The receiver can now be taken into the lab for testing or repair.
Opening the Receiver
Ensure you are grounded with the anti-static strap!
Remove removing the bolts from the stoppers, but keep the stoppers in place. Once removed the triangular front mounting bracket will slide off.

Recessed into the case are 6 screws that need to be undone. the location of 4 of these are shown in the image below. Loosen the screws using a Phillips head screwdriver. The will no come all the way out.

Place the receiver on it side and cautiously partially open the case. The SMA cable connecting the two halves together needs to be disconnected before the case can be fully opened. Carefully loosen the SMA cable on the Horizontal polarisation side and disconnect the cable.

Cautiously fully open the case. There is a full replica of the Auxiliary box under the bench. If testing is to be performed then this will need to be connected. Note that the CRIO out at the antenna will also need to be powered on. Ensuring that the power is off, connect the cables to the receiver.
Whenever disconnecting or connecting components to the receiver, ensure that the power is off!


Reconnect the SMA cable between the two halves of the receivers.
Connecting the Power Meter
If required for testing, the power meter will need to be connected to the either the horizontal or vertical polarisation. The power meter is normally kept in the correlator room.

Connect the power meter to the appropriate polarisation as shown below.

Replacing the LNA
Ensure that power is off to the receiver. The LNA locations is shown below. It is in the same place on the other half of the receiver for the other polarisation.

Carefully unsolder the black and red wires connected to the LNA.
Undo the nuts on either side of the LNA. To undo they will move towards the LNA.
Remove the allen bolts fixing the LNA to the case.
Carefully remove the LNA.
Add some silicone heat sink compound to the base of the new LNA.
Repeat the process in reverse to install the new LNA.
Brightscram Adjustment
Occasionally, the brightscram sensors will need to be tested or adjusted. A clear day with full sun is required for this adjustment. Antennas 1 to 8 have a bright scram sensor.
There are two major components to the brightscram sensor: The buffer board and the sensor. The sensor is located on the antenna feed as shown in the image below.

The sensor needs to be aligned with the point of the feed.
The buffer board is located in the auxiliary box as shown below.

Refer to the annotated image below and follow the procedure below to adjust the brightscram settings.

- With the antenna pointing at the Sun, measure the voltage between Vsense and Ground.
- Measure the voltage between Vtrig (Pin 2 on the U8 chip) and ground.
- Adjust this voltage by turning the screw on Trig Adj (labelled VR3 on the board). The Voltage here should be about 0.05 V BELOW that of VSense.
- Once done, using the spray container, wet the dish. The dish should move off the sun and return 10 minutes later. If it does not, you will need to adjust Vtrig until it does.
UPS Battery Replacement
Periodically, the batteries on the Uninterruptable Power Supplies (UPS) will need replacing. There are 4 in total: one in each of the four central racks and one in the network rack. The LCD at the front of the UPS will display a message when the batteries need to be replaced as shown below.

Below is an annotated image of the UPS front panel showing the important components.

To remove the battery pack, follow the instructions below.
- Undo the three screws on the front chasis.
- Disconnect the blue battery connector.
- Lift the battery back and pull out. Be careful! It is heavy!.
- See the image below of the removed battery pack.

- Remove the top cover by undoing the screws at either end of the tray. The image below shows the batteries within the tray.

Resetting the ManLight
Detach the serial cable from the ACC and connect to a serial to USB adapter. Connect this to the laptop.
Check the serial ports in Device manager to obtain the com port number.
Click on Start -> PRD Serial -> main.exe.
Select Setup and change COM1 to the appropriate port.
In the Enables tab disable IP, IT and ITF monitor ports.
Start the program running by clicking on the arrow in the upper left.
In the Control tabs set the following:
- 'ACC mode pump current 1' to 250 and press the LOAD button.
- 'AM - EDFA Mode' to ACC - constant current and press the load button.
- 'LO - loss Output Power Alarm threshold' to 20 and press the load button.
If any load button does not underpress, the GUI is hung up and rebooting the computer may be necessary. In that case you can start where you left off.
Antenna A Power Outage and Reset
Recycling Power to Antenna A
To recycle power to Antenna A goto http://pduanta.solar.pvt and enter the username and password.
There will be eight devices that can be chosen from. Click Cycle to recycle the power to the appropriate option.
You may need to follow the procedure below to bring Antenna A back to operation.
Recovering Antenna A from a Power Outage
On the Stateframe display click on the CryoRX tab. This will bring up the display shown below.

Recycling Power to the FEM
Login to the feanta machine as follows:
ssh antctl@feanta
If the FEM Outlets on the CryoRX window are marked as Off then from a Helios terminal:
Then type in the command:
/home/antctl/starburst/femTools/src/starburstControl start
Otherwise recycle the power to the FEM as follows:
/home/antctl/starburst/femTools/src/starburstControl stop
Wait about 10 seconds and the issue the start command:
/home/antctl/starburst/femTools/src/starburstControl start
Once done type in:
exit
Recycling Power to the Brick
If faults are showing on the Motor section (4th green line down) the Brick power will need to be recycled. To do this issue the following commands from the Schedule Window:
outlet 3 off ant14
outlet 3 on ant14
Restarting the LNAs
From a Helios terminal:
ssh root@lna14.solar.pvt
If you get an error "No route to host" you will need to restart the computer at the 27m antenna by issuing the commands below from the Schedule Window:
outlet 6 off ant14
outlet 6 on ant14
Then issue the command from the terminal:
./killAll python
Then press the up arrow until the most recent python command is found and press enter. Text will scroll up continuously Just type exit even with the text scrolling to exit the ssh session.
From Schedule issue the command:
$lna-init ant14
The Drain Voltage for Hi H will be incorrect (~.61 when it should be 1.2). To correct this, from Schedule issue:
lna drain hh 2.4 ant14
Aligning the Receivers
Only do this once Mark Hodges has confirmed that he does NOT have the external vacuum pump connected!
The receivers must be properly aligned. From Schedule send the command:
frm-home ant14
If the receivers do not home properly, you will need to cycle power on the brick: http://ovsa.njit.edu//wiki/index.php/Owen%27s_Notes#Recycling_Power_to_the_Brick
It will take a few minutes for the FRM to find its home position. Once it has send the command:
frm-set-pa 0 ant14
to zero the positions.
Set the Hi Receiver:
rx-select hi ant14
Ant A Maths Error
Goto the webpage https://ant14.solar.pvt. You should get to the screen as shown below:

Ensure that on the left under the SP image that there is a green 'Ready' message.
If there is a Maths Error then follow the following procedure.
Click on the Login tab and enter the username and password.
Click on the Parameter tab to see the following screen:

Click on view next to #10.
At the next screen click on view next to Item #10.00:

In the Update Value box enter 1070 and click on Change
Click on the arrow near the top of the page to return to menu 10.
Click on View next to Item #10.38
In the Update Value box enter 100 and click on Change.
Preventing the Receiver from Moving During Maintenance
During some types of maintenance, the receiver should not be moved. To prevent this from happening, log into feanta:
ssh antctl@feanta
and then issue the command:
/home/antctl/starburst/femTools/src/starburstControl stop
Type exit to end the feanta session.
To reactivate, log back into feanta and send the command:
/home/antctl/starburst/femTools/src/starburstControl start
Note that this resets every evening. If a shutdown is required for longer than that then feanta may need to be shutdown.
Site Wide Power Outage
Most of the procedures to recover from a site wide power outage are covered above. Below are the the steps required in order.
27m Antenna (Antenna A)
Refer to the procedure here: http://www.ovsa.njit.edu/wiki/index.php/Owen%27s_Notes#Recovering_Antenna_A_from_a_Power_Outage
2m Antennas (Antennas 1-13)
For any antennas that have a communications failure (highlighted in red in the communications section of the Stateframe Display) follow the procedures here: http://www.ovsa.njit.edu/wiki/index.php/Owen%27s_Notes#Antenna_Communications_Failure
It may take some time for the CRIOs to restart. If after 20 minutes a CRIO has not restarted, redo the procedure.
Stop the schedule by clicking on the stop button.
Stow the antennas by issuing the command
stow
If some of the antennas did not stow the refer to Antenna trouble shooting: http://www.ovsa.njit.edu/wiki/index.php/Owen%27s_Notes#Antenna_Trouble_Shooting
If an antenna is highlighted in the Power and Attenuation section on the stateframe display then you may need to reload the .ini file to the CRIO as described here: http://www.ovsa.njit.edu/wiki/index.php/Owen%27s_Notes#Warning_on_Power_and_Attenuation
Data Backup
Local IDB File Backup
Periodically IDB files will need to be moved from pipeline. Currently these are being stored on NAS4. Typically a year of data will be copied. Follow the procedure below (replace nas4 with the appropriate drive):
- Login to pipeline. an then issue the command:
screen -S filecopy
- Enter the command;
cp -r -v /data1/eovsa/fits/IDB/yyyy* /nas4/IDB/
- where yyyy is the year of the files to copy.
- Press <CRTL>AD to exit the screen
Caltech IDB File Backup
IDB files are copied onto two USB drives and mailed to Caltech. The drives hold approximately three months of IDB data. Use the following procedure to copy the files.
- Connect the USB drives to your local computer. Make a note of the last file on the disk. Delete all of the IDB, FDB and IFDB files from the drives.
- Connect the drive to the USB port at the back of the pipeline machine.
- Login to the user account on pipeline.
- List the available drives by typing the command:
sudo fdisk -l
- A list of drives will appear. Find the line similar to the one below:
/dev/sdc1 2048 7813969919 7813967872 3.7T Microsoft basic data
- Note that the device might be different to /dev/sdc1, but it will be the 3.7T drive. In the rest of these instructions assumes that the device is /dev/sdc1. Replace this with whatever is the appropriate device.
- Mount the USB drive:
sudo mount /dev/sdc1 /media/IDB-backup1
- Open the IDB backup script using nano:
nano owen/archiveIDB.sh
- Find the two lines similar to:
start=$(date -d "2020-09-13" +%Y%m%d)
end=$(date -d "2020-12-31" +%Y%m%d)
- Change the start date to the day after the last date of the previous data copy and the end date to 3 months further on.
- Press [CTRL][X] and the Y to exit and save the file.
- If a screen named filecopy does not exist then issue the following command:
screen -S filecopy
- If the screen does exist then
screen -r filecopy
- To start the filecopy issue the following commands:
cd ~/owen
./archiveIDB.sh
- You can then press [CTRL][a][d] to exit the screen.
Once the copy has been completed, unmount the drive:
sudo umount /media/IDB-backup1
Repeat the process for the second drive.
Common Files
The common folder on Helios is backed up automatically on Sundays at midnight. This backup is stored on the nas2 drive. To manually back up the folder, issue the following commands from a helios terminal:
screen -S commoncopy
- Enter the command:
rsync -av --delete --progress --log-file=/home/sched/rsynclogs/rsync_common.log -e ssh /common/ user@pipeline:/nas2/common/
- Press <CRTL>AD to exit the screen
Output from rsync is logged in /home/sched/rsynclogs/rsync_common.log
Crontab Backups
The crontab files are backed up on nas2 in the crontabs folder.
The helios crontab is stored in helios_cron
The pipeline crontab is stored in pipeline_cron
The dpp crontab is stored in dpp_cron
Location of IDB and Associated Files
| Date Range | Location |
|---|---|
| 2014 to 2015 | nas3/IDB2014-15 |
| 2016-01-01 to 2016-07-31 | nas1 |
| 2016-08-01 to 2016-11-30 | nas2 |
| 2016-12-01 to 2021-02-28 | nas3/IDB |
| 2021-03-01 to 2021-12-31 | nas4/IDB |
| Date Range | Location |
|---|---|
| 2013-12-19 to 2015012031 | nas3/FDB2014-15 |
| 2016-01-01 to 2016-07-31 | nas1/FDB |
| 2016-08-01 to 2016-11-30 | nas2/FDB |
| 2016-12-01 to 2021-02-28 | nas3/FDB |
| 2021-03-01 to 2021-12-31 | nas4/FDB |
| Date Range | Location |
|---|---|
| 2014-01-24 to 2015012031 | nas3/IFDB2014-15 |
| 2016-01-01 to 2016-07-31 | nas1/IFDB |
| 2016-08-01 to 2016-11-30 | nas2/IFDB |
| 2016-12-01 to 2021-02-28 | nas3/IFDB |
| 2021-03-01 to 2021-12-31 | nas4/IFDB |
Schedule Command Description
NOTE: All Schedule commands accept as optional arguments a list of antennas to which the command should selectively sent. Accepted syntaxes are:
Command ant1 ant2 ant3
Command ant1-3
Command subarray1
Command subarray2
If no antenna list is indicated, the command is sent to all antennas currently in subarray1.
These commands can be found in the ~/Dropbox/EOVSA\ M\&C/EOVSA\ Schedule\ Commands.docx and ~/Dropbox/OVSA\ Expansion/Design/Antennas/Ant_A\&B_Commands.pdf files.
Commands handled directly by ACC
ABORT
- Aborts all commands sent to ACC but not yet executed
CLEAROFF [antenna list]
- Sets all AzEl or RaDec offsets to zero
DCMATTN HPOLattn VPOLattn [antenna list]
- Indicates the VPOL and HPOL attenuations for the DCM modules indicated in the list. The attenuations are applied on the next second start.
Warning: The command is executed only if the DCM modules are in manual mode (see the DCMAUTO-ON and DCMAUTO-OFF command below)
DCMAUTO-OFF [antenna list]
- Sets the DCM modules in the manual attenuation mode. This mode allows the attenuations requested by the DCMATTN to be applied.
DCMAUTO-ON [antenna list]
- Sets the DCM modules in the automatic attenuation mode. This mode ignores the manual DCMATTN commands and applies the attenuation set through the DCMOFFSET mechanism.
DCMOFFSET inc1 inc2…..inc50
- Sets the 50 DCM attenuation offset increments to be added to the current list of DCM offset attenuations to be cycled during each second, starting with the next second boundary. The command expects up to 50 arguments. If fewer arguments are provided, the existing set is repeated in the same sequence until all 50 slots are filled. This command is only intended for testing. During normal operations, the DCM offsets states are requested by the DPP computer when needed.
Warning: The command is executed only if the DCM modules are in auto mode (see the DCMAUTO-ON and DCMAUTO-OFF command below).
- NOTE: The DCM offsets are changed on the edge of the next second after a TCP/IP message is received by ACC at the TCP.dpp.port (default port: 6344-set in ACC.ini file ). The message is expected to be a fixed length binary string having the following format: 50 32bit integers (I32)
DCMOFFSET-CLEAR
- Clears the current list of 50 DCM offset attenuations that are applied when DCMAUTO-ON is set.
Warning: This command clears the offset attenuations for all DCM modules.
DCMTABLE [antennalist] filename
- Request the antenna list portion of a specific DCM base attenuation table to be uploaded on the respective DCM modules. The DCM table must have 30 columns and 50 rows, each pair of adjacent columns listing the HPOL-VPOL pairs for each of the 50 slots of a tuning sequence. The DCM table text file must be located in the ACC “c:\parm” directory and its default name is “DCM.txt”.
- The DCM/table_timeout key in the ACC.ini files have to be manually edited in order to modify the default timeout (ms) of the DCM modules when a table is broadcasted.
- The actual DCM attenuations for a given tuning slot are calculated based on the following formula
DCM_atten[pol,tuning_index]=DCM_base_atten[pol,tuning_index]+DCM_offset[broadcasted]
DPPOFFSET-OFF
- Ignores DCM offset attenuation recommendations sent by DPP but still allows setting the offsets via the DCMOFFSET schedule command.
DPPOFFSET-ON
- Applies DCM offset attenuation recommendations sent by DPP but still allows setting the offsets via the DCMOFFSET schedule command.
- NOTE: This is the default behavior of the system after each hardware ACC reboot or after a REBOOT or RESET command is sent via TCP/IP to the emergency 6543 acc.solar.ini port
FEM-INIT
- Initialize all front-end module base attenuations with the values read from the ACC initialization file: “c:\ni-rt\startup\acc.ini”.
FEMATTN level [antennalist]
- Manually selects the front-end attenuation levels for the antennas indicated in the list to be applied on the next second boundary. The attenuation level selects the corresponding entry in the “c:\parms\FEMATTN.txt” attenuation FEM table located on each the cRIOs.
- The attenuation level set by this command is saved in the [FEM AGC] section of the “c:\ni-rt\startup\crio.ini” and it is automatically applied when the module is restarted.
Warning: The attenuation level setting may be overwritten by the AGC loop, if active.
- The format of the table is as shown below (column heads are added here for clarity)
| FEMATTN level | First attenuation | Second attenuation | Total attenuation |
|---|---|---|---|
| 0 | 0 | 0 | 0 |
| 1 | 0 | 3 | 3 |
| 2 | 0 | 6 | 6 |
| 3 | 0 | 9 | 9 |
| 4 | 0 | 12 | 12 |
| 5 | 0 | 15 | 15 |
| 6 | 0 | 18 | 18 |
| 7 | 9 | 12 | 21 |
| 8 | 9 | 15 | 24 |
| 9 | 9 | 18 | 27 |
| 10 | 9 | 21 | 30 |
| 11 | 9 | 24 | 33 |
| 12 | 9 | 27 | 36 |
| 13 | 18 | 21 | 39 |
| 14 | 18 | 24 | 42 |
| 15 | 31 | 31 | 62 |
- The actual FEM attenuations applied as the result of a FEMATTN command are given by
- HPOL_ATTENUATION=HPOL_BASE+FEMATTN.txt(level)
- VPOL_ATTENUATION=VPOL_BASE+FEMTTTN.txt(level)
- Where Attenuation, Base, and FEMATTN.txt(level) are two elements vectors indicating the settings for the First and Second attenuators.
HATTN first second [antennalist]
- Sets the FEM HPOL_BASE first and second attenuators for the antennas in the list, and overwrites the corresponding sections in the global “c:\ni-rt\startup\acc.ini” file, as well as in the local “c:\ni-rt\startup\crio.ini” files.
VATTN first second [antennalist]
- Sets the FEM VPOL_BASE first and second attenuators for the antennas in the list, and overwrites the corresponding sections in the global “c:\ni-rt\startup\acc.ini” file, as well as in the local “c:\ni-rt\startup\crio.ini” files.
FSEQ-FILE filename
- Tells ACC to upload to the Hittite synthesizer the frequency sequence located at “c:\parm\filename”.
FSEQ-INIT
- Initializes the Hittite synthesizer according to the settings defined in the [LO Configuration] section of the “c:\ni-rt\startup\acc.ini” file.
FSEQ-ON
- Starts the tuning sequence
FSEQ-OFF
- Stops the tuning sequence
FSEQ-SCRIPT filename
- Sends, line by line, to the Hittite synthesizer the command sequence listed in the “c:\parm\filename” script file.
LO1A-REBOOT
- Commands the PDU controller to recycle the power on the LO1A Hittite synthesizer
LO1B-REBOOT
- Not implemented yet
LO1A-WRITE command
- Sends the specified command to the LO1A Hittite synthesizer
LO1B-WRITE command
- Sends the specified command to the LO1B Hittite synthesizer
SERVICE [antennalist]
- Takes the antennas in the list out of subarray1 or subarray2 and drives them to the service position.
Warning: Once in service position, the serviced antenna should be put in local operation mode in order to avoid it being controlled by a subsequent schedule command.
SUBARRAY1 antennalist
- Puts all antennas in the list into subarray1. All antennas than are not listed, but currently in subarray1, are taken out from subarray1.
- NOTE: As of Dec 03 2015, this command no longer switches by default the LO connector to an alternative source. To force the LO connector to switch switches, one must use the new explicit command SUBARRAY1_SWITCH antennalist
SUBARRAY2 antennalist
- Puts all antennas in the list, which are not already in subarray1, into subarray2. In order to move a given antenna from subarray1 to subarray2, one should first redefine subarray1.
- NOTE: As of Dec 03 2015, this command no longer switches by default the LO connector to an alternative source. To force the LO connector to switch switches, one must use the new explicit command SUBARRAY2_SWITCH antennalist
SYNC [antennalist]
- Restarts the real-time executable on all cRIOs corresponding to the antenna list.
- NOTE: Unlike the general convention, not providing a list of antennas commands all cRIOs to restarts their execution.
TRACKTABLE filename [antennalist]
- Uploads to all antennas in the list the tracking table located at “c:\parm\filename”
TRAJ-FILE filename [antennalist]
- Uploads to all cRIOs corresponding to antennas in the list the trajectory file table located at “c:\parm\filename”
UNLISTEDCOMMAND [antennalist]
- Any command not listed above is sent for local execution to all cRIOs corresponding to antennas in the list.
Commands handled by cRIOs
NOTE: These commands are selectively sent by ACC to all antennas in the optional argument antennalist, or, if not present, to all antennas in subarray1
AGC active [low [high [samples]]]
- Activates (1) or deactivates (0) the front end automatic gain control loop, which adjust the FEMATTN level when both of the HPOL and VPOL voltages, averaged over the given number of consecutive samples , cross the low and high voltage limits. Missing parameter values are uploaded from the [FEM AGC] section of the local “c:\ni-rt\startup\crio.ini” file. All parameters provided when an AGC command is issued are saved in the same file for further use.
- NOTE: At startup, the AGC loop is activated or not according with the latest active value written in the initialization file.
AZELOFF azoff eloff
- Sets the Azimuth and Elevation offsets indicated in the argument list
RADECOFF raoff decoff
- Sets the RA and DEC offsets indicated in the argument list
FLUSH
- Flush the existing tracktable from the associated antenna controller
ND-ON and ND-OFF
- Set on/off the local noise diode.
POSITION azimuth elevation
- Requests a given azel position
RESTART
- Reboots the cRIO
DRIVE-RESET
- Resets Antenna controller
STOP
- Stops the antenna
STOW
- Stows the antenna
TRACK
- Sets antenna in track mode
TEC-LOG
- Dumps all TEC register values to the local log file “c:\tec.txt” for debugging purposes
TEC-INIT
- Initializes the TEC controller with register values hard-coded in the crio code. These were read from a working controller at some time in the past.
TEC$BC
- Reboot the TEC controller to recover from a bad or stuck state.
TEC$SC
- Clear the error status of the TEC controller. Does nothing other than this, and is purely asthetic.
TRAJ-ON and TRAJ-OFF
- Starts/Ends the execution of the trajectory script
- NOTE: At startup, the WINDSCRAM loop is activated or not according with the latest active written in the initialization file.
BSCRAM-ON
- Activate the BRIGHTSCRAM Monitor
BSCRAM-OFF
- Deactivate the BRIGHTSCRAM Monitor
BSCRAM-CLEAR
- Takes the antenna out of the BRIGHTSCRAM Active State independently of the brightness sensor state.
- If the BRIGHTSCRAM Monitor’s operation mode is set to STOW, clearing the BRIGHSCRAM ACTIVE state does not have any effect on the mechanical state of the antenna. If the BRIGHTSCRAM Monitor’s operation mode is set to OFFSET, clearing the BRIGHSCRAM ACTIVE state results in removing the AZEL offsets
- Note: If the BRIGHTSCRAM Monitor is active, the antenna may get back in the Active State depending on the state of the brightness sensor.
BSCRAM-SET
- Force the antenna into the BRIGHTSCRAM Active State independently of the brightness sensor state.
BSCRAM-WAIT seconds
- Sets the BRIGHTSCRAM Monitor waiting time before clearing the BRIGHSCRAM ACTIVE state.
- Note: This setting is saved in the crio.ini file and remains persistent until changed
BSCRAM-OFFSET
- Sets the BRIGHTSCRAM operation mode to stow the antenna when in active state.
- Note: This setting is saved in the crio.ini file and remains persistent until changed
BSCRAM-OFFSET
- Sets the BRIGHTSCRAM operation mode to apply offsets
- Note: This setting is saved in the crio.ini file and remains persistent until changed
BSCRAM-AZELOFF azoff eloff
- Sets the Azimuth and Elevation Offsets (degrees) for the BRIGHTSCRAM offset operation mode.
- Note: This setting is saved in the crio.ini file and remains persistent until changed. Default values re AZOFF=0 and ELOFF=10
Warning: No action is taken if less than 2 arguments are provided
WSCRAM-ON
- Activate the WINDSCRAM Monitor
WSCRAM-OFF
- Deactivate the WINDSCRAM Monitor
WSCRAM-LIMIT value
- Sets the wind speed threshold.
- Note: This setting is saved in the crio.ini file and remains persistent across reboots until changed.
WSCRAM-WAIT seconds
- Sets the WINDSCRAM Monitor waiting time between checking the wind speed.
- Note: This setting is saved in the crio.ini file and remains persistent across reboots until changed.
UpdateElevationDiagnostics 1
- Requests an update of the elevation trip register.
UpdateAzimuthDiagnostics 1
- Requests an update of the azimuth trip register.
REGWRITE address value
- Writes to a specific (new type) antenna register address the specified value. This command is ignored by the old type antennas.
- For example,
- REGWRITE 23386 2 [antlist]
- may be used to set the controller in velocity mode. Note that the velocity rate registers must also be set to control the velocity of motion. The appropriate registers are:
- AzimuthVelocity, or 23585
- ElevationVelocity, or 23605
- Alternatively, one can write to a specific register address by directly sending a command formed by the name of the register (as defined in the M&C document Controller_registers.xlsx) followed the desired value to be written.
- For example one may alternatively set the controller in velocity mode by issuing the command
- RUNMODE 2 [antlist]
- A possible need for velocity mode is to drive an antenna off a hard limit. For safety, the only way to do that is to set the controller in velocity mode and provide a velocity in the direction to drive off the limit. For example, if Ant 6 is on an azimuth low hard limit, one can drive it off by the following sequence:
- RUNMODE 2 ANT6
- AZIMUTHVELOCITY 5000 ANT6
- Wait for hard limit to clear.
- AZIMUTHVELOCITY 0 ANT6
- TRACK ANT6
Antenna A (Antenna 14) Commands
Note: Only antenna A is currently in use. In the commands below the value of [ant] is ant14, the value of [rx] is hi or lo (for the receiver), and the value of [lna] can be lv, lh, hv or hh.
FRM-HOME [ant]
- Homes the x-axis (receiver select) and position angle axis.
FRM-RX-SEL [rx] [ant]
- Move x and z axes to select receiver.
FRM-SET-PA [pa] [ant]
- Set the position angle, [pa] for polarization. Pointing to the south is 0 degrees. The PA can range from -90 to 90 degrees.
FRM-X-OFFSET [xoff] [ant]
- Offset in x relative to the selected reciever. In effect until a new value is set or the Geo Brick is reset.
FRM-Z-OFFSET [zoff] [ant]
- Offset in z relative to the selected reciever. In effect until a new value is set or the Geo Brick is reset.
FRM-ABS-X [xpos] [ant]
- Set to an absolute x position. Not used.
FRM-ABS-Z [zpos] [ant]
- Set to an absolute z position. Not used.
FRM-KILL [ant]
- Kill all motors. They will be unpowered.
FRM-ENABLE [ant]
- Enable all motors after a kill.
OUTLET [out] [state] [ant]
- Turns the selected outlet on or off. [out] is a value from 1 to 8 and [state] is either on or off.
ND-ON [ant]
- Turns the noise diode on via the power strip.
ND-OFF [ant]
- Turns the noise diode off via the power strip.
RX-SELECT [rx] [ant]
- Moves the requested receiver to focus and sets the RF switch appropriately.
LNA-GATE1 [lna] [vg1] [ant]
- Sets the first gate bias on the selected amplifier to the request voltage ([vg1] in range of -2.0 to 2.0). Will only operate if that amplifier is enabled.
LNA-GATE2 [lna] [vg2] [ant]
- Sets the second gate bias on the selected amplifier to the request voltage ([vg2] in range of -2.0 to 2.0). Will only operate if that amplifier is enabled.
LNA-DRAIN [lna] [vd] [ant]
- Sets the drain bias ([vd] in range 0.0 to 2.0) on the selected amplifier. Will only operate if that amplifier is enabled.
LNA-ENABLE [lna] [state] [ant]
- Turn the requested amplifier on or off.
Local Commands
These commands are all executed locally. Any command with a '$' in front of it is a local command.
$MK_TABLES [fname] [source]
- Creates the tracktable for the named [source], writes it to the filename given by [fname], for example, sun_tab.radec, pcal_tab.radec, or geosat_tab and stores it in the /parm directory on the ACC. This file can then be sent to the antennas via the TRACKTABLE command. This must be performed at the start of each scan in order for the antennas to track the source.
$FEM_INIT <antlist>
- Invokes a sequence of commands to (1) read the current front-end power levels, (2) calculate any attenuation change needed to adjust the power levels to the range 1-4 dBm, and (3) send the attenuation adjustments to the antennas. The result is that the front end power levels are adjusted to this range. It acts on the antennas given in the antenna list <antlist>, or on all antennas in the current subarray if <antlist> is omitted. This command changes the gain calibration, so should only be done prior to the start of a day's observations if possible. This is part of the System Gain Cal procedure.
$PLUSDELAY [nsec]
- Relay specific command that adds given delay argument (in nanoseconds) to the Ant 14 low frequency receiver. Delays both X and Y in the current delay center table. This writes the changed record as a new record in the SQL database.
$CAPTURE-1S <stem>
- Capture 1 second of data on the dpp. <stem> is an optional string to add to the end of the capture filename. This will take a few seconds to complete.
$WSCRAM-LIMIT [limit]
- Update the 27-m windscram limit. the limit is in miles per hour.
$SCAN-START <NODATA>
- Starts data collection. Command by itself is normal scan start, while $SCAN-START NODATA means set up scan, but do not take data. The NODATA option is used for some calibrations.
$SCAN-RESTART
- This command is for restarting a scan with the same setup as the previously running scan, where only the scan state must be turned on.
$SCAN-STOP
- This command stops a scan.
$PA-SWEEP [PA] [RATE]
- Rotate 27-m focus rotation mechanism to sweep through a given angle range (does nothing if PA adjustment routine is already running). The angle is swept from -[PA] to [PA] at rate of 1-degree-per-[RATE] (s)
$PA-TRACK ant14 [CROSSED]
- Track 27-m focus rotation mechanism to correct for parallactic angle of given antenna (does nothing if antenna not correctly specified). [CROSSED] should have value TRUE or FALSE.
$PA-STOP
- Aborts a running position-angle sequence (started by $PA-SWEEP or $PA-TRACK commands) that is controlling the Antenna 14 focus rotation mechanism.
$TRIPS
- Send commands to update antenna trip information.
$DLASWEEP [ant] [dla] [dlastop] <pol>
- Starts a relative delay sweep on antenna [ant] (an integer, i.e. ant1), <pol> ('X', 'Y', or if omitted, both) ranging from delay step [dla] to [dlastop]. This will sweep the delay by 1 step per second for delays from [dla] to [dlastop] relative to the current nominal delay. For example, $DLASWEEP 2 5 10 X will sweep the X delay on ant2 by adding 5 steps up to 10 steps, one step per second. The start and/or stop delays can be negative, but [dla] must be less than [dlastop]. Note, if [ant] is 0, the delay of the specified polarization is swept for all antennas. Used for some total power tests.
$WAIT [secs]
- Waits the number of specified seconds before executing the next command.
$PCYCLE [dev] [antlist]
- Cycle the power of some device (antenna controller, fem, or crio). If [dev] is omitted then the antenna controller is cycled. The options for [dev] are ANT, FEM or CRIO.
$KATADC_GET
- Get the standard deviation for each KatADC (assumes frequency tuning is static).
- Note, takes about 0.2 s for each active ROACH.
$REWIND
- Get date of first line of current schedule and increment by 1 day, then auto-generate a new schedule.
$LNA-INIT
- Get LNA_settings.txt file from ACC and send the series of commands needed to set the LNA voltages.
$SUBARRAY' [antlist]
- Run the SUBARRRAY1 command if this is the master schedule, otherwise run the SUBARRAY2 command.
Useful Tools and Utilities
Screen Command
On linux systems, the screen command allows a program to be run in the background. This is particularly useful for processes that take a long time to complete. In addition it will display output when the screen is activated.
To start a screen session, open up a terminal and issue the command:
screen
Text will appear and you will be prompted to press space or return. Just press return.
Type in the command that you want to be performed. The process will then start.
To scroll up and down within the screen press <CRTL> A <ESC>. This enters Copy Mode. You can then use the up and down arrows to scroll. Press <ESC> to exit copy mode. Note that you cannot enter commands in copy mode.
You can exit the screen by pressing <CRTL> A D The command will still be running. To re-open the screen at any time simply type:
screen -r
You can have more than one screen running at a time. In this case it is advisable to give a screen a name. For example:
screen -S schedule
will assign the name 'schedule' to the screen. To access this screen after it has been closed, use the command:
screen -r schedule
To list the currently active screens use the command:
screen -ls
To terminate a program running in a screen, from within the screen press <CRTL> Z
In the example below the ping command was stopped and fives the following output:

The [1] is the job number. To completely terminate it issue the command:
kill %1
To close a screen session type exit
If a screen is not responding, you can kill it and all programs running within it by pressing <CRTL> A K and then press Y when asked if you really want to kill the session.
Determining if a Screen is Attached to the Current Terminal
To determine if a Screen is attached to the current terminal issue the command:
echo $STY
If the output is a blank line then the attached to the terminal. However if the name of a screen is displayed then that screen is attached. For example the output displayed when the schedule screen is attached will be similar to:
17558.schedule
Screens on Helios
The Helios .bashrc and .screenrc files have been modified so that the title of the terminal displays the screen name when you enter that screen.
If the Operating system is reinstalled on helios then the following lines should be added to the bottom of the .bashrc file if they are not already present.
# This function sets the title of a Terminal window
function settitle() {
    if [ -n "$STY" ] ; then         # We are in a screen session
        echo "Setting screen titles to $@"
        printf "\033k%s\033\\" "$@"
        screen -X eval "at \\# title $@" "shelltitle $@"
    else
        printf "\033]0;%s\007" "$@"
    fi
}
Also add the following lines to the .screenrc file if they are not present.
#This section will set the title on entering a screen
termcapinfo xterm* 'hs:ts=\E]0;:fs=\007:ds=\E]0;\007'
defhstatus "Screen $STY"
hardstatus off
Once done, you will either need to restart the bash session or issue the command:
source .bashrc
Note that after these titles will only be displayed on newly started screens, not ones that are running at the time the scripts were running.
The above code is a slightly modified version of the code found here: https://code-and-hacks.peculier.com/articles/setting-terminal-title-in-gnu-screen/
df Command
On linux systems, the df command lists all of the file systems currently mounted on computer.
The command is simply:
df
More usefully, issuing the command:
df -h
will display the file sizes in 'human readable' format. Below is an example from pipeline of the output of df -h:

Whatup Program
The whatup program will display a plot of sources that are currently available. A sample plot is shown below.

The program must be run from helios and ipython. To run ensure you are logged into a helios terminal and issue the following commands
cd /common/python/current</p>
ipython --pylab
import whatup
whatup.whatup()
This will display a plot of sources (Altitude vs Time) visible to the 27m Antenna from the current time for the next 24 hours. The following optional arguments can be supplied:
- dur - the duration of the plot in hours
- t - the UT start time of the plot
For example, the following commands
from util import Time</p>
whatup.whatup(dur=6, t=Time("2020-10-01 14:00:00"))
will display a plot from 2020-10-01 14:00:00 for a duration of 6 hours as shown below:

renice: Changing priority of a program
If, on a linux system, a program is using to many resources, it is possible to use the renice> command to set it to a different priority.
From a terminal, type the command:
ps -elf | grep [program]
where [program] is the name of the program whose priority you wish to change.
Below is an example with output:
user@dpp:/$ ps -elf | grep rsync
4 S root      21761  0  80   0 - 16638 -      18:52 pts/3    00:00:00 sudo rsync -av --exclude=/dev --exclude=/data1/IDB --exclude=/lost+found --exclude=/media --exclude=/mnt --exclude=/nas1 --exclude=/proc --exclude=/sbdata --delete / /sbdata/dpp-backup/
4 S root      22708  2  80   0 - 47670 -      18:52 pts/3    00:01:25 rsync -av --exclude=/dev --exclude=/data1/IDB --exclude=/lost+found --exclude=/media --exclude=/mnt --exclude=/nas1 --exclude=/proc --exclude=/sbdata --delete / /sbdata/dpp-backup/
1 S root      22710 22709  1  80   0 - 24727 -      18:52 pts/3    00:00:34 rsync -av --exclude=/dev --exclude=/data1/IDB --exclude=/lost+found --exclude=/media --exclude=/mnt --exclude=/nas1 --exclude=/proc --exclude=/sbdata --delete / /sbdata/dpp-backup/
1 D root      22711 22710  9  80   0 - 34724 -      18:52 pts/3    00:04:38 rsync -av --exclude=/dev --exclude=/data1/IDB --exclude=/lost+found --exclude=/media --exclude=/mnt --exclude=/nas1 --exclude=/proc --exclude=/sbdata --delete / /sbdata/dpp-backup/
Here we looked for the rsync command and found 4 occurrences. The 8th column (marked here in red) is the priority.
The priority ranges from -19 (highest priority) to 19 (lowest priority)
To change the priority of a program issue the command:
sudo renice -n [pr] -p [PID]
where [pr] is the new priority number and [PID] is the process identification number. The PID is the 4th column across in the display above (marked in green).
Caps Lock Toggle Using the Onscreen Keyboard
Occasionally, the caps lock key will get stuck in the on position. if you are logged in remotely, pressing caps lock on your keyboard will not fix this problem. Instead, follow the procedure below.
- VNC into helios and click on the available helios terminal.
- Enter the command sudo onboard
- You will then need to enter the helios password. Note: If the caps lock is on you will need to press the shift key for any lowercase letters. For uppercase letters there will be no shift. That is, the keys for letters only will be inverted.
- The following screen will appear. When the caps lock is on, the caps key to the left of the onscreen keyboard is red. Note that the schedule will disappear as only windows that allow keyboard entry will be visible. However, it is still running.

- Click on the caps lock key to turn it off. The caps lock key should return to being black.
- To exit the Onscreen keyboard click on the [X] on the upper right of the onscreen keyboard as shown below.

- The Onscreen Keyboard will still be running in the background. To stop it, click on the terminal window where you started the keyboard and the press [CRTL] C.
Plotting Stateframe Data
It is often useful to be able to access and plot Stateframe data.
Plotting Stateframe Data using the Stateframe Display
On the stateframe display, click on the Create tab shown below:

A screen similar to that below will be displayed. If there is already a graph present click on the Clear Graph tab shown below.

By selecting items one at a time from left to write next to 'Select item to add' you can choose what to plot. The click on 'Add Selected Item' By repeating this process more than on data set can be plotted on a graph at a time.
Using Python to plot Stateframe Data
This section describes, with an example, the procedure for plotting Stateframe data using python. This is useful as it allows time periods longer than an hour to be plotted.
Suppose we wish to plot the vertical polarization power over a 1 hour period from 2020-10-05 00:00 to 2020-10-05 01:00.
Firstly, from a pipeline terminal, access ipython:
ipython --pylab
Next import the required libraries:
import dbutil as db
from util import Time
import numpy as np
Now set up the cursor:
cursor = db.get_cursor()
The time range is set as follows (Just replace the times in quotes with new start and end times):
trange=Time(['2020-10-05 00:00','2020-10-05 01:00']).lv.astype(int)
Now we set up a query string which will search the data base:
query = 'select Timestamp,Ante_Fron_FEM_VPol_Power from fV66_vD15 where (I15 % 15) = 3 and Timestamp between '+str(trange[0])+' and '+str(trange[1])+' order by Timestamp'
Some explanation here is required.
Timestamp is the time for each data point.
Ante_Fron_FEM_VPol_Power is the variable for the VPOL power. The name of each variable can be retrieved by looking at the variables an the Create tab on the stateframe display. Note that except for the last variable, it is only the first 4 characters (or fewer if there are less than 4) that make up the name.
fV66_vD15 is the database from which the data is to be retrieved.
(I15 % 15) = 3 will give the data for the antenna. I15 denotes that there are 15 antennas. This takes the record number mod 15 and will only extract a record when this equals 3 (antenna 4, as the values here are 0 indexed).
It will also only extract values in the specified time range.
Finally we want the data ordered by timestamp.
Now we retrieve the requested data:
data, msg = db.do_query(cursor,query)
The data is stored in a dictionary. We can view the keys as follows:
data.keys()
This will produce an output as follows:
[u'Timestamp', u'Ante_Fron_FEM_VPol_Power']
We convert the timestamps to numpy times:
dt = np.array(Time(data['Timestamp'].astype(float), format = 'lv').isot,dtype = 'datetime64')
The labels for the plot can be set if desired:
title('VPOL Power vs Time')
xlabel('Universal Time')
ylabel('Power (dB)')
Finally the data is plotted:
plot(dt,data['Ante_Fron_FEM_VPol_Power'])
A sample plot is shown below:

This plot looks rather cluttered. The number of points can be reduced if we modify our query:
query = 'select Timestamp,Ante_Fron_FEM_VPol_Power from fV66_vD15 where (I15 % 15) = 3 and Timestamp between '+str(trange[0])+' and '+str(trange[1])+' and (cast(Timestamp as bigint) % 10) = 0 order by Timestamp'
We then request the data again,convert the timestamps to numpy times and replot the data producing:

Suppose we want to plot both the HPol Power and VPol power on the same plot. This is not difficult to do. We simply modify our query again:
query = 'select Timestamp,Ante_Fron_FEM_VPol_Power,Ante_Fron_FEM_HPol_Power from fV66_vD15 where (I15 % 15) = 3 and Timestamp between '+str(trange[0])+' and '+str(trange[1])+' and (cast(Timestamp as bigint) % 10) = 0 order by Timestamp'
Now HPol has been added and we just send this query as above. If we look at the keys now we see:
[u'Timestamp', u'Ante_Fron_FEM_HPol_Power', u'Ante_Fron_FEM_VPol_Power']
To plot this data as a scatter plot we use the following commands:
hpol, = plot(dt,data['Ante_Fron_FEM_HPol_Power'].astype(float),'o', label='HPOL')
vpol, = plot(dt,data['Ante_Fron_FEM_VPol_Power'],'o', label='VPOL')
legend(handles=[hpol,vpol])
which produces this plot:

Power Meter Setup
The user manual for the power meter can be found at https://literature.cdn.keysight.com/litweb/pdf/E4418-90032.pdf
Before use the power meter will need to be zeroed and calibrated.
1. Ensure that the sensor is not connected to anything.
2. Press the ZERO/CAL button.
3. Press the button next to [Zero] displayed on the screen. It will take several seconds to zero.
4. Next remove the SMA adaptor from the end of the sensor and connect the sensor to the POWER REF socket on the power meter as shown below.

5. Press the button next to [CAL] displayed on the screen. It will take several seconds.
6. The SMA power sensor can now be disconnected from the POWER REF socket and the SMA adaptor reconnected.
Vector Network Analyser Setup

Basic startup and operation
Turn on the VNA using the Power button at the front. Note that there is also a power switch on the back of the VNA. Ensure this is on.
Connect the blue SMA cables to the VNA.
Press the power button.
Press the 'BW-Avg Power' soft-key.
Click on Output Power.
Ensure RF-off is checked.
Under Power, enter the VNA output Power.
Press the 'Freq' soft-key
Enter the start frequency and end frequency.
Connect port 1 to the input of the device to be tested.
Connect port 2 to the output of the device to be tested.
Press the 'BW-Avg Power' soft-key.
Uncheck RF-off.
Autoscale Display
Press the 'Scale' soft key.
Click on Auto-Scale Trace.
Average Trace
Press the 'BW-Avg Power' soft-key.
Select Moving Average.
Set Factor. This is the number of sweeps the trace is averaged over.
Check On.
Saving a Trace
Press the 'Trace' soft key.
Click on Trace Data.
Click on Ascii
Under Contents select Active Trace.
Under Output format select dB Mag-Phase.
Under Field Separator select Comma.
Under Decimal select Point.
Enter the folder and filename.
Click on Save.
Other
DPP Fix Packets Details
Basic Operation and Monitoring
As of August 2021 the interrupt priority is handled largely automatically. This section describes the updated programs.
The program that handles reassignment of the CPUs and packet monitoring in called dpp_fix_packets.py and is located in the /common/python/current/ folder.
However this is typically not run directly. Rather it is run from a script on the DPP: /home/user/test_svn/shell_scripts/start_fix_packets.sh
This script checks to see if the dpp_fix_packets.py program is running. If it is not then it will restart it. Note that the actual line in the script that starts dpp_fix_packets.py is as follows:
screen -S fixpackets -d -m python /common/python/current/dpp_fix_packets.py
This command starts the dpp_fix_packets.py in a screen named "fixpackets" in detatched mode ("-d -m").
To access the screen, and hence the output of the program simply type screen -r fixpackets
This should show output that updates every minute as shown below:

Note that I will normally show the fixpackets screen in a terminal after I have rebooted the DPP (OG)
Information is also written to the /common/webplots/dpp_fix_packets_log.txt file. This contains the last 20 lines of significant output of the dpp_fix_packets.py program. This file is read by the stateframe display. In addition it writes the CPUs currently used by the fix packets program to the /common/webplots/dpp_cpu.txt file. This is also read by the stateframe display.
At the bottom of the stateframe display is a section titled Last DPP Fix Packets Messages. This displays the last 3 messages by dpp_fix_packets.py. An example is given below:

This will display potentially 4 different types of messages:
- Packet Loss Detected: This notifies that there was a packet loss and the interfaces are being reset.
- dpp_fix_packets.py has been restarted: Indicates that the fix packets program has restarted. This will normally occur after a reboot of the DPP.
- Resetting CPUs - Using CPUs 18 and 19: Notifies that the CPUs being used were change. Valid CPU pairs are [18 19], [20 21], [21 22].
- DPP REBOOT REQUIRED!: This indicates that all CPU pairs have been used and that the DPP should be rebooted.
Startup Script and Automatic Monitoring
The /home/user/test_svn/shell_scripts/start_fix_packets.sh is run at DPP startup. The following command is placed in the crontab file:
@reboot /bin/bash /home/user/test_svn/shell_scripts/start_fix_packets.sh
This starts the script on reboot (or startup).
Additionally this same script is run every 10 minutes in order to ensure that the program is still running. It will not restart dpp_fix_packets.py if it is already running. This command is also present in the crontab file:
*/10 * * * * /home/user/test_svn/shell_scripts/start_fix_packets.sh
Windscram
A windscram occurs when the wind exceeds 18 miles/hour for 5 minutes. While a windscram can occur at any time, it is only important during a phasecal, as this is typically the only time that the 27m antenna is tracking. The 27m will stow during a windscram. Note that when the wind drops the antenna will not resume tracking. If the wind has dropped for a significant period of time, you can resume 27m operation by issuing the command:
track ant14
from the schedule window.
You can check the wind speed history by clicking on temps. The solid gray line is the average wind speed.
Reloading the crio.ini File
DO THIS WITH EXTREME CAUTION. BE ABSOLUTELY CERTAIN THAT RELOADING THE CRIO FILE IS REQUIRED.
For antenna 11, see the special case here:
After uploading the new crio.ini file the gains and pointing may also need to be updated.
Manually uploading the crio.ini file
From helios, open a terminal and type cd /home/sched/Dropbox/PythonCode/Current/crio_inis
For the antenna that needs to be reset, find the most recent '.ini' file. For example, for antenna 10 this may be 'crio10-2019-09-28.ini'. Make a note of this file.
Enter the command ftp crio10.solar.pvt. Replace crio10 with the apropriate CRIO number.
Enter the username and password when prompted.
Enter the following commands:
cd ni-rt/startup
put crio10-2019-09-28.ini crio.ini
bye
replacing 'crio10-2019-09-28.ini' with the appropriate file for the CRIO that needs to be reset.
The above commands have reloaded the crio.ini file. The CRIO now needs to be reset. For example, Antenna 10 will be reset by issuing the following commands from the schedule window:
sync ant10
tracktable sun_tab.radec ant10
track
Using ipython to Upload the crio.ini File
From helios, open a terminal and access ipython:
ipython --pylab
Load the crio.py file by entering:
import crio
Simply issue the command:
crio.reload_crio_ini('ant#')
where # is the antenna number. The most recent crio.ini file will be uploaded for that antenna.
Power Meter Setup
The user manual for the power meter can be found at https://literature.cdn.keysight.com/litweb/pdf/E4418-90032.pdf
Before use the power meter will need to be zeroed and calibrated.
1. Ensure that the sensor is not connected to anything.
2. Press the ZERO/CAL button.
3. Press the button next to [Zero] displayed on the screen. It will take several seconds to zero.
4. Next remove the SMA adaptor from the end of the sensor and connect the sensor to the POWER REF socket on the power meter as shown below.
5. Press the button next to [CAL] displayed on the screen. It will take several seconds.
6. The SMA power sensor can now be disconnected from the POWER REF socket and the SMA adaptor reconnected.
Moving the New Antennas Manually
Power off the antenna by turning the power switch at the bottom right of the Antenna Control Box. Switch the Maint/Norm Switch to Maint. Switch the Remote Switch to Remote.

Remove the block from the hand controller port. Remember to place the block back after you have finished working on the antenna. It will not run in remote without it!

Connect the hand controller to the port.

Turn the power switch back on. The antenna can now be moved to a suitable position using the azimuth and elevation controls on the hand controller.

Moving the Old Antennas Manually
At the lower right of the control box, there is a panel for controlling the antenna manually as shown below.

Move the bottom center switch to Local. The antenna can now be positioned using the HA and Dec switches.
Antenna Stowing at End of Day
Antennas 1 to 8 are not stowed after observations. Therefore, the antennas will be highlighted as red as they will still be tracking (see image below). There is no need to take any action for these antennas.

Antenna 11 will need to be stowed manually after observations are complete. To do this, enter the commands below:
stop ant11
stow ant11
Service Stow
Use this procedure to place the antenna into its service stow position.
NOTE: do NOT use the service command. This seems to also reset the CRIO.
From the schedule window issue the command:
position 225 15 ant#
where ant# is the antenna to place into service stow.
Stopping and Restarting Helios VNC
If the helios VNC server needs to be stopped then you will need to find the process ID number (PID#). From a helios terminal issue the following command:
ps -A | grep vnc
You will see a line that looks something like:
26626 ? 00:00:00 x11vnc
The number on the left is the PID#, in this case 26626. To stop VNC issue the command
kill PID#
where in this case PID# would be 26626
Note that doing this will cut the VNC connection to any users that are currently logged in.
To restart VNC issue the command:
x11vnc -shared -display :0 -forever -noxrecord -clip 1920x1200+0+0 -bg -usepw -rfbport 20000 -auth /home/sched/.Xauthority
Note that VNC is started when Helios is started. The startup script for VNC is located in: /etc/init/x11vnc.conf
Helios Bash Aliases
The aliases for various bash command can be found in the .bash_aliases file
Shutting off the 27m Control System
At times during maintenance on the 27m antenna it may be necessary to turn off the control system to prevent anyone from moving the antenna. To do this perform the following steps.
- Log into the feanta machine from helios:
ssh antctl@feanta
- Issue the command (note you can use the up arrow until you find the command):
/home/antctl/starburst/femTools/src/starburstControl stop
- Log out of feanta by issuing the command:
exit
- There is a crontask that periodically restarts the control system on helios. Issue the command:
crontab -e
- This will allow you to edit the crontab file. Scroll down to find the line that reads:
1 1,5,9,13,17,21 * * * ssh -t antctl@feanta /home/antctl/starburst/femTools/src/starburstControl start
- Place a # in front of this line so that it reads:
#1 1,5,9,13,17,21 * * * ssh -t antctl@feanta /home/antctl/starburst/femTools/src/starburstControl start
- Press CRTL x and then answer Y to save the file.
Note that when maintenance has finished you will need to edit the crontab file again and remove the # from that line.
Installing Computer Updates
Pipeline, Helios and the DPP require regular updates. To install updates, follow the following procedure:
- Log in to a terminal on a computer that is to be updated.
- Issue the following command:
sudo apt update && sudo apt upgrade -y
- Restart the computer by:
sudo reboot now
Setting up SSH Keys
To access a computer without a password via SSH, you cant set up SSH keys that allow password-less access between computers. These instructions are for linux.
Open a terminal on the local computer. Ensure that you are logged in as the appropriate user. Issue the command:
ssh-keygen -t dsa -f {remote_computer}
where {remote_computer} is the name of the computer that you wish to access.
This will create two files:
{remote_computer}
{remote_computer}.pub
Now use scp to copy the {remote_computer}.pub file to the remote computer.
scp {remote_computer}.pub {user}@{remote_computer}:
Enter the password when prompted. Note that {user} is the user name of the account that you wish to access.
Log into the remote computer using ssh.
ssh {user}@{remote_computer}
Now copy the contents of the {remote_computer}.pub file to ~/.ssh/authorized_keys2
cat {remote_computer}.pub >> ~/.ssh/authorized_keys2
You may need to change permissions on the new file:
chmod 600 ~/.ssh/authorized_keys2
Remove the original file:
rm {remote_computer}.pub
Logout from the remote computer:
exit
Start the ssh agent:
eval `ssh-agent -s`
Now add the identity:
ssh-add ~/.ssh/identity_{remote_computer}
You should now be able to log in to the remote computer without a password.
Changing Antenna Settings at the Controller
At the antenna, place the antenna into standby.
Make sure you select the correct controller (Azimuth or Elevation).
On the controller, press M to enable menu selection.
Use the left and right arrows to select the appropriate menu and the up and down arrows to select the appropriate parameters.
Press M again to edit the chosen parameter.
Use the left and right arrows to shift to the digit you want to change and use the up and down arrows to enter the required digit.
Once the parameter has been updated, press M to get back to menu selection.
If setting menu 20 parameters, go to parameter 15.19 and press the up arrow. This option will change from off to on and then back to off. This will save the parameter.
For any other menus, go to parameter 0.00 and change it to 1000.
Press M to exit the menu selection.
Return the antenna to operate and reboot the antenna for changes to take affect.
Data Analysis
Installing Suncasa on Ubuntu 22
Some of the libraries (including python3.8) that are required for suncasa are not part of the Ubuntu 22 distribution. The following is a summary of the instructions to install suncasa on Ubuntu 22 and later versions.
Update Ubuntu and add old repositories:
sudo apt update && sudo apt upgrade
sudo apt install software-properties-common
sudo add-apt-repository ppa:deadsnakes/ppa
Install python3.8:
sudo apt install python3.8
Install python 3.8 virtual environment:
sudo apt-get install python3.8-venv
Create a suncasa python environment:
python3.8 -m venv suncasaenv
Activate the suncasa environment:
source suncasaenv/bin/activate
Install pip, suncasa and ipython:
pip install --upgrade pip wheel
pip install suncasa
pip install ipython3
Cleanup the cache so different version of python and ipython are not being used:
hash -r
Check that the installation works:
ipython3
import suncasa
help(suncasa)
import casatasks
help(casatasks)
To exit from the suncasa environment:
deactivate
Exit from ipython:
exit
Set up EOVSA packages and site:
printf "import sys \nimport os \nimport sysconfig \nimport casatools \nimport casadata \nimport time \nlogfile='casalog-{}.log'.format(time.strftime('%%Y%%m%%d-%%H',time.localtime())) \ntelemetry_enabled = False \ncrashreporter_enabled = True \ntb=casatools.table() \nospathsep = os.path.sep \nlibpath = sysconfig.get_paths()['purelib'] \nobsdict = {'MJD': 57447.0, 'Name': 'EOVSA', 'Type': 'WGS84', 'Long': -118.287, \n            'Lat': 37.2332, 'Height': 1207.13, 'X': 0.0, 'Y': 0.0, 'Z': 0.0,  \n            'Source': 'Dale Gary'} \nobstable = os.path.join(casadata.datapath,'geodetic','Observatories') \ntb.open(obstable, nomodify=True) \nif 'EOVSA' not in tb.getcol('Name'): \n    print('Adding EOVSA to the Observatories') \n    tb.close() \n    tb.open(obstable, nomodify=False) \n    nrows = tb.nrows() \n tb.addrows(1) \n for k in obsdict.keys(): \n        tb.putcell(k, nrows, obsdict[k])     \ntb.close() \n" > $HOME/.casa/config.py
echo "sitepackagepath = '$HOME/suncasaenv/lib/python3.8/site-packages'" >> $HOME/.casa/config.py
echo "if sitepackagepath not in sys.path:" >> $HOME/.casa/config.py
echo "    sys.path.append(sitepackagepath)"     >> $HOME/.casa/config.py
To exit the suncasa environment:
deactivate
Note that you must be in the suncasa environment to use suncasa!
EOVSA synoptic Fits Images
This section is mostly to do with how to load an view EOVSA synoptic FITS images.
From pipelne change to the /common/python/mapping folder.
From ipython, issue the following commands to load the required libraries:
from fits2map import *
from plot_map import *
The files can be found at http://www.ovsa.njit.edu/fits/synoptic/. To see what files are available click on the appropriate folder.
To load a particular file you would issue the command:
eomap1 = fits2map("eomap1=fits2map("http://www.ovsa.njit.edu/fits/synoptic/2020/05/19/eovsa_20200519.spw06-10.tb.disk.fits")
In this case it would load a full disk image from 2020-05-19 created from bands 6 to 10 into eomap1.
To view the image issue the command:
plot_map(eomap1)
This will produce a plot similar to that below.

The image parameters are stored as a dictionary and can be viewed by:
eomap1.keys()
For more information see http://www.ovsa.njit.edu/wiki/index.php/Mapping_Software
Antenna Optical Power at the DCM
The following table shows the measured optical power for each antenna at the DCM measured at the given date. Values of HI indicate the power meter saturated.
| Ant # | Power (dB) | Date |
|---|---|---|
| 1 | HI | 2022-05-18 |
| 2 | HI | 2022-05-18 |
| 3 | HI | 2022-05-18 |
| 4 | HI | 2022-05-18 |
| 4 | HI | 2022-05-18 |
| 5 | HI | 2022-05-18 |
| 6 | HI | 2022-05-18 |
| 7 | 3.88 | 2022-05-18 |
| 8 | HI | 2022-05-18 |
| 9 | 5.36 | 2022-05-18 |
| 10 | HI | 2022-05-18 |
| 11 | 4.40 | 2022-05-18 |
| 12 | HI | 2022-05-18 |
| 13 | HI | 2022-05-18 |
Maintenance
Routine Maintenance
Old Antennas (9-11,13)
| Antenna | Last Done | Next Scheduled |
|---|---|---|
| 9 | 2022-09-02 | 2023-03-02 |
| 10 | 2022-09-02 | 2023-03-02 |
| 11 | 2022-09-02 | 2023-03-02 |
| 13 | 2022-09-02 | 2023-03-02 |
Antenna Components
Spin RF Feeds
| Antenna | Serial No. | Tag No. |
|---|---|---|
| 1 | CC2D03Q18R | 52393 |
| 2 | CC2D01Q18R | 52394 |
| 3 | CC2D05Q18R | 52395 |
| 4 | CC2D08Q18R | 52396 |
| 5 | CC2D07Q18R | 52397 |
| 6 | CC2D11Q18R | 52398 |
| 7 | CC2D10Q18R | 52399 |
| 8 | CC2D12Q18R | 52400 |
| 9 | CC2D04Q18R | 52401 |
| 10 | CC2D06Q18R | 52402 |
| 11 | DU2D01Q18R | 52403 |
| 12 | CC2D09Q18R | 52404 |
| 13 | CC2D02Q18R | 52405 |
Antenna 1
| Component | Module | Model No. | Serial No. | Purchase Date | Repair Date | Install Date |
|---|---|---|---|---|---|---|
| LNA (H) | FEM | |||||
| LNA (V) | FEM | |||||
| Attenuator 1 (H) | FEM | |||||
| Attenuator 2 (H) | FEM | |||||
| Attenuator 1 (V) | FEM | |||||
| Attenuator 2 (V) | FEM | |||||
| Optical Link (H) | FEM | |||||
| Optical Link (V) | FEM | |||||
| Temperature Controller | AUX | |||||
| CRIO | ANT |
Component Supplier List
| Component | Model No. | Spares On Site | Purchase Date | Supplier | Website | Phone No. |
|---|---|---|---|---|---|---|
| LNA | LNA-30-00101800-25-10P-MM | 2 | L3Harris Narada Miteq | https://nardamiteq.com/ | 631-231-1700 | |
| LNA | AFS4-00101800-25-10P-12V-4 | 3 | L3Harris Narada Miteq | https://nardamiteq.com/ | 631-231-1700 | |
| Optical Link (1544.47nm) | LT-20-M | 1 | OEQuest | https://oequest.com/ | 602-343-1496 | |
| Optical Link (1562nm) | LT-20-M | 1 | OEQuest | https://oequest.com/ | 602-343-1496 | |
| 2CH DWDM Demux Module | BWDM21D0CRV11+BWDM21D0CRV13 | 1 | OEQuest | https://oequest.com/ | 602-343-1496 | |
| Inclinometer | DAS-90-A | 2 | Level Developments | https://www.leveldevelopments.com/ | 312-465-1082 | |
| Temperature Controller | 145001 (TC-XX-PR-59) Rev 2,4 | 2 | Laird Thermal Systems | https://www.lairdthermal.com/ | 919-597-7300 | |
| CRIO | cRIO-9074 | 1 | National Instruments | https://www.ni.com/en-us.html | 888-280-7645 | |
| Mag Switch | XS3P12NA340 | 1 | Telemecanique Sensors | https://tesensors.com/global/en | 888-280-7645 | |
| Attenuator |