Uploads by Bchen
Jump to navigation
Jump to search
This special page shows all uploaded files.
| Date | Name | Thumbnail | Size | Description | Versions |
|---|---|---|---|---|---|
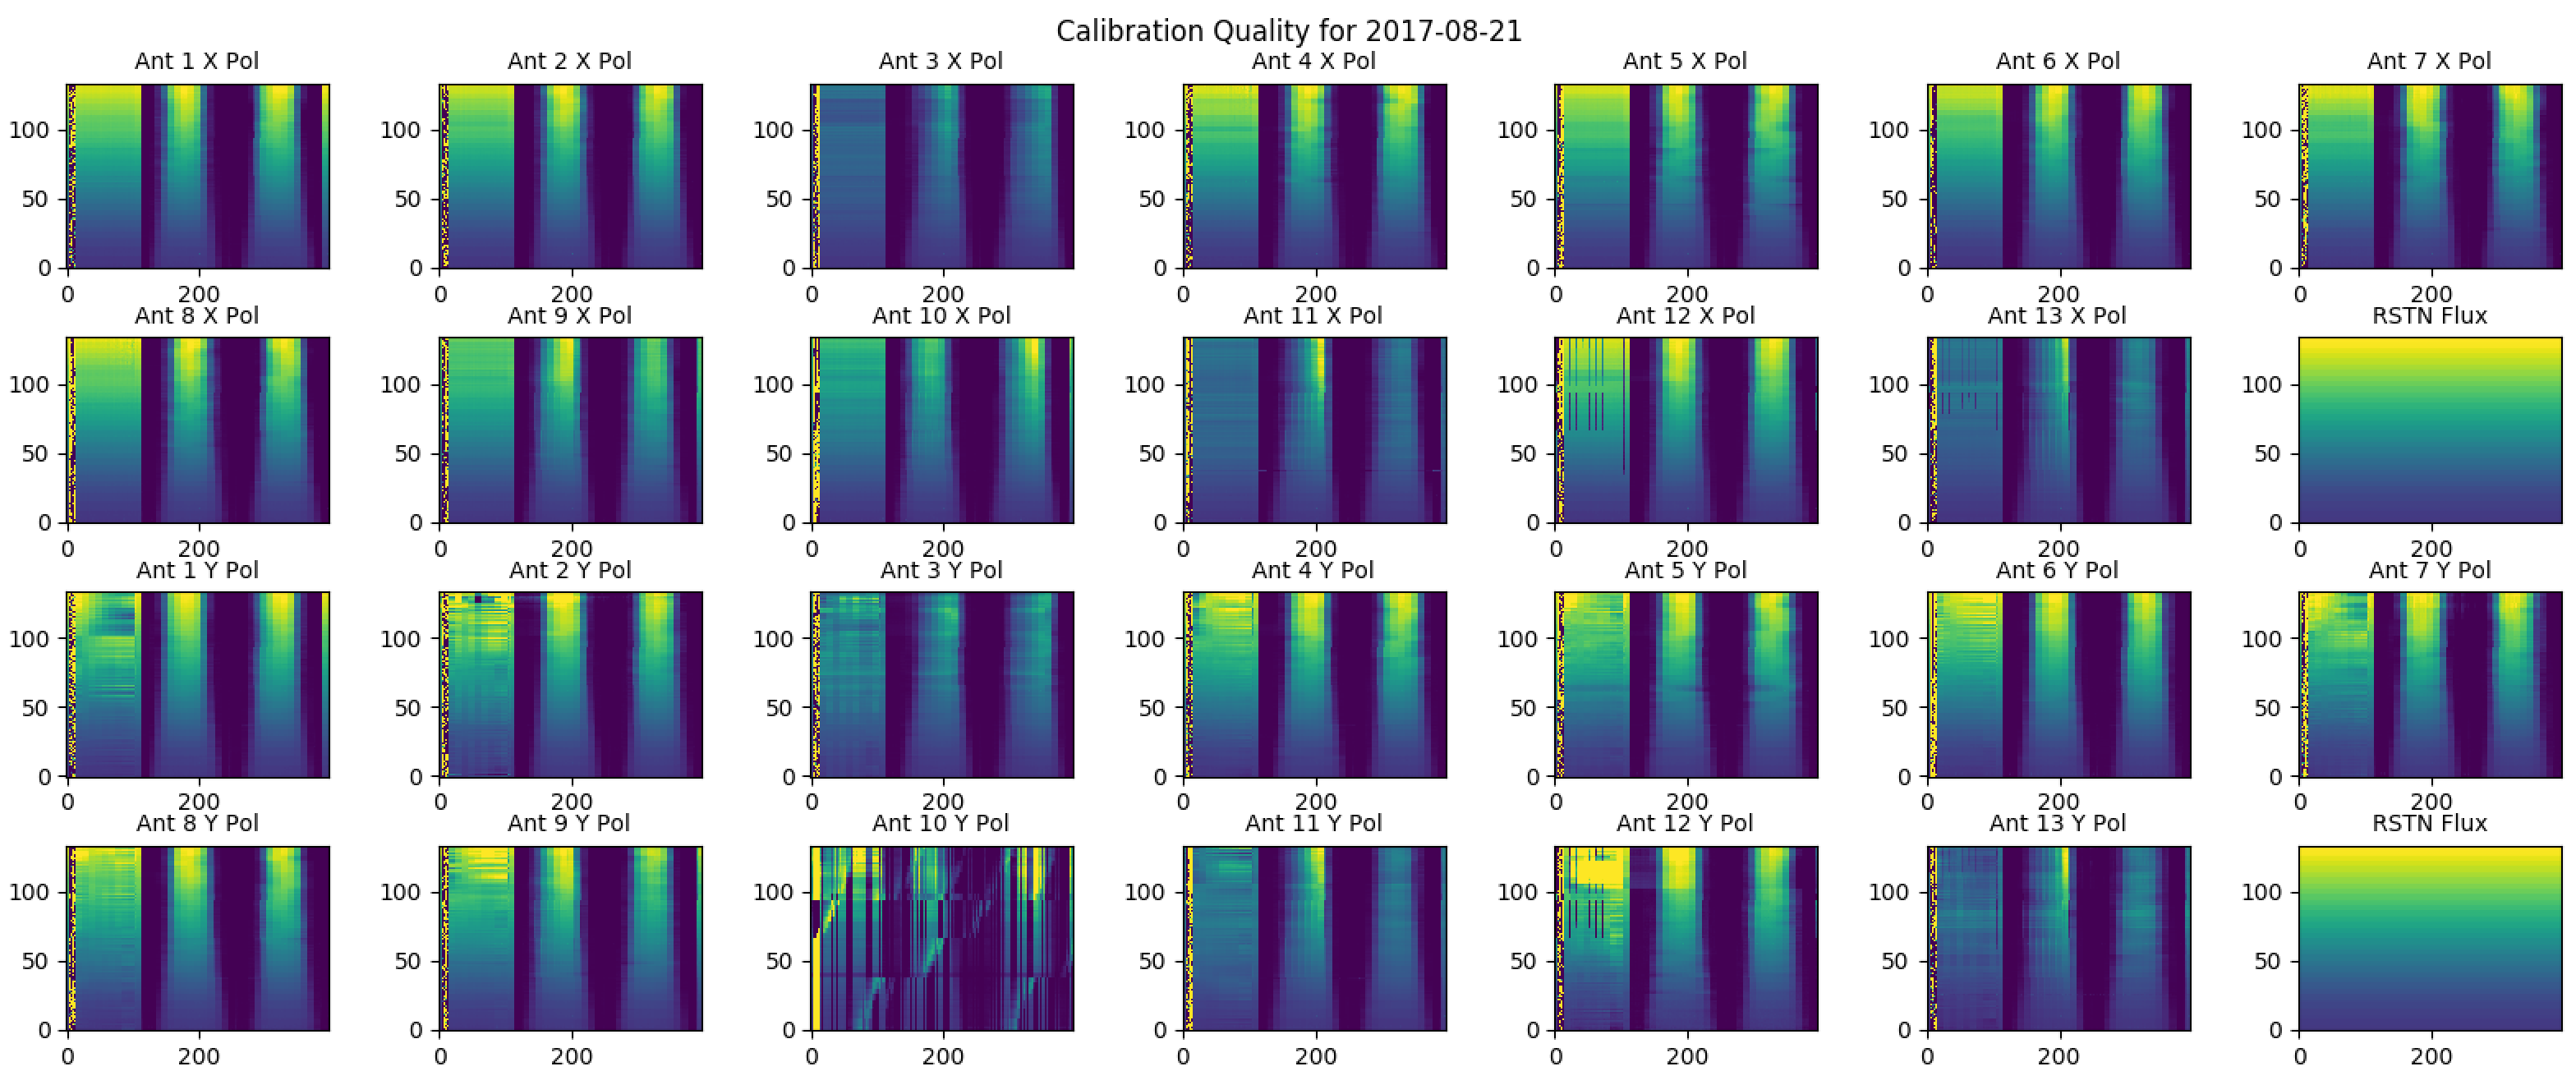
| 15:28, 19 July 2019 | Fig-tp calqual.png (file) |  |
711 KB | Quality of total-power calibration | 1 |
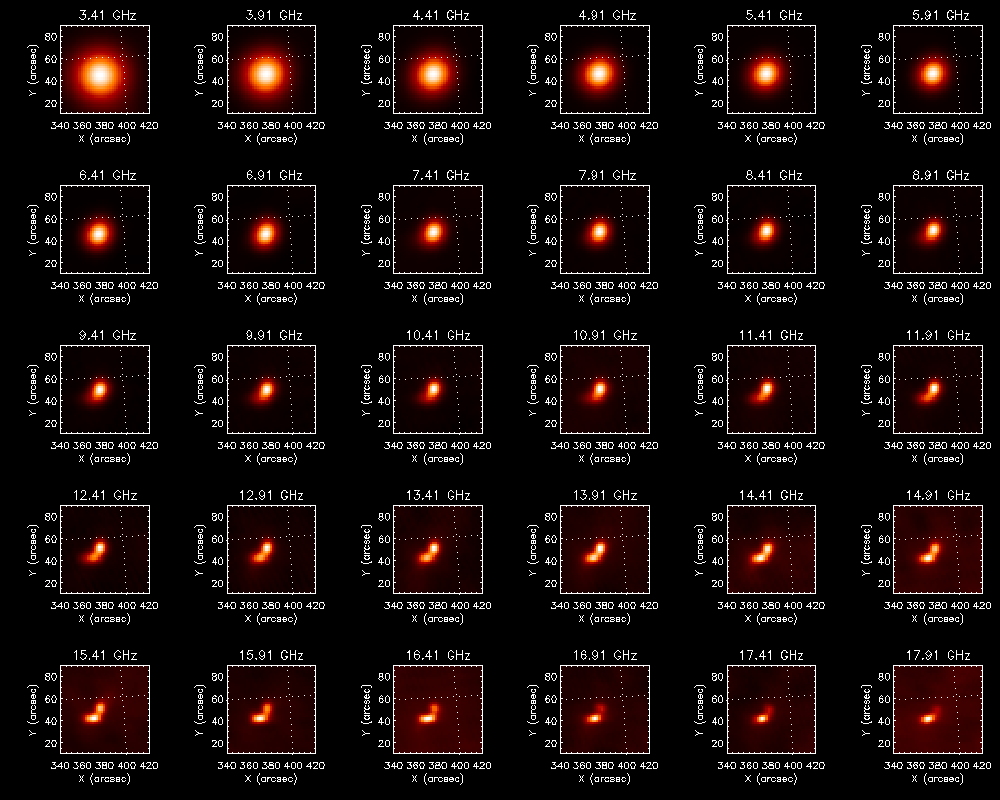
| 16:17, 29 May 2019 | Fig-specimg.png (file) |  |
147 KB | Example of EOVSA spectroscopic imaging at one selected time. | 1 |
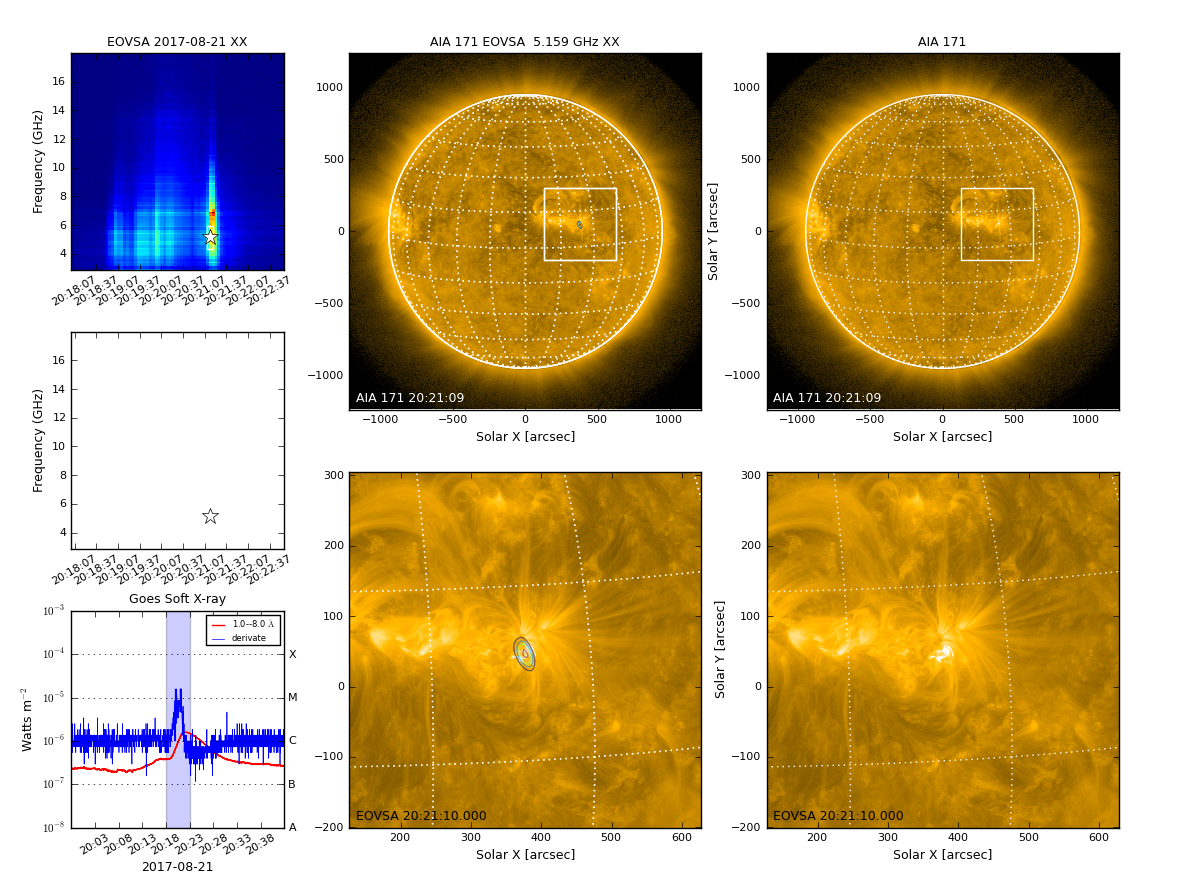
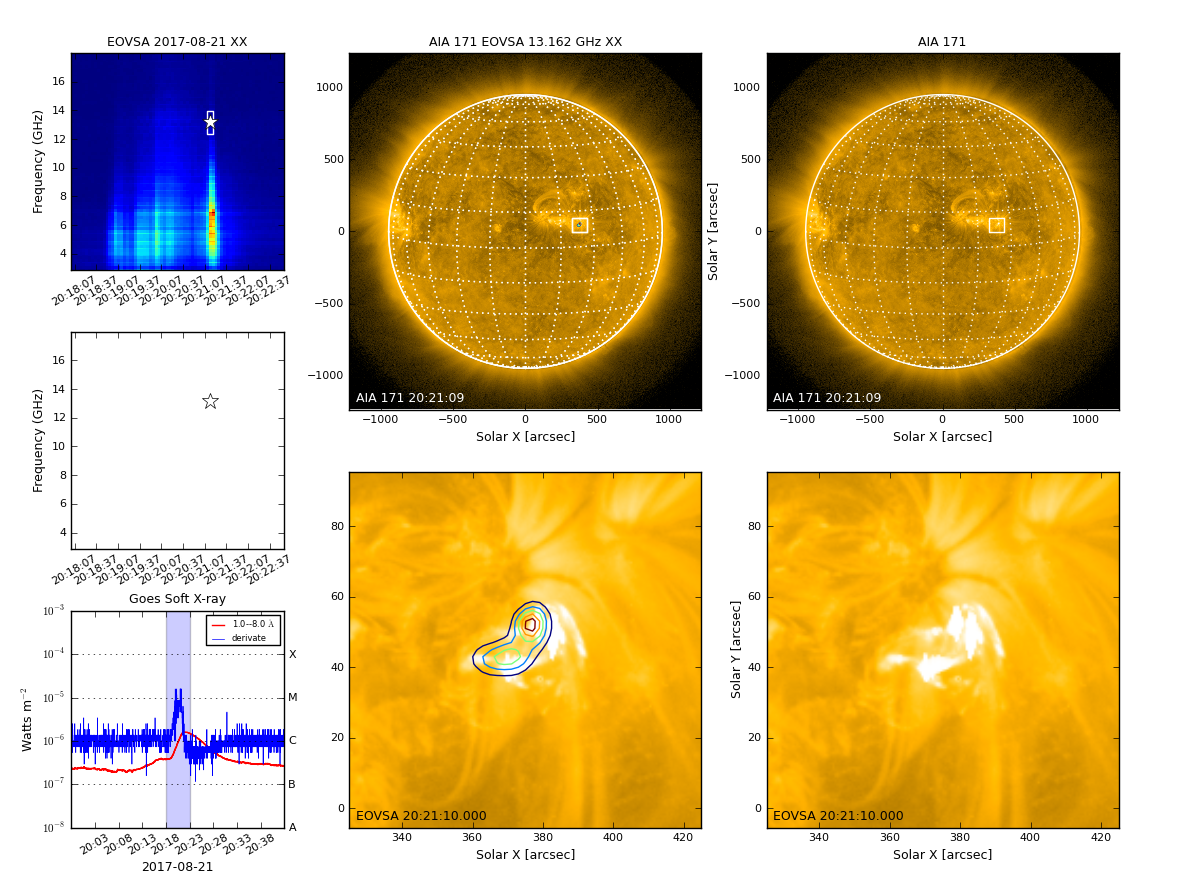
| 13:40, 24 May 2019 | Fig-qlookplot1.png (file) |  |
529 KB | EOVSA quicklook imaging at selected time range and frequency range. Background shows SDO/AIA 171 angstrom image at the closest time. | 1 |
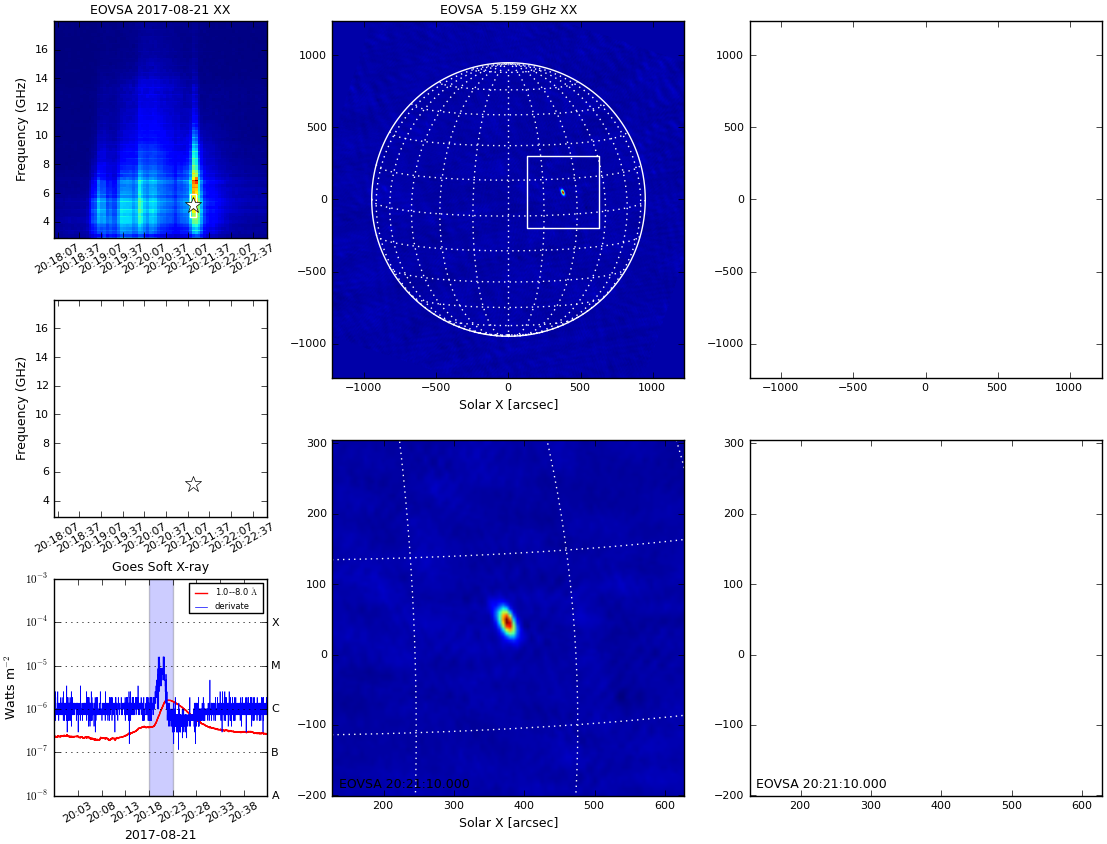
| 13:19, 24 May 2019 | Fig-qlookplot0.png (file) |  |
327 KB | EOVSA quicklook imaging at a selected time range and frequency range. | 1 |
| 12:48, 20 May 2019 | Fig-qlookplot3.png (file) |  |
463 KB | Fix GOES plot date. | 2 |
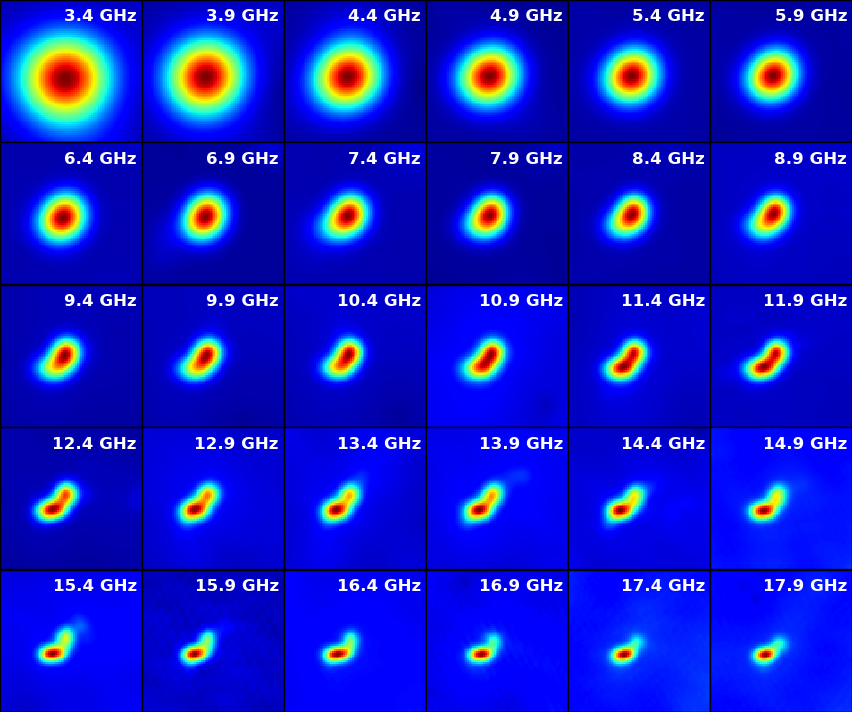
| 10:53, 20 May 2019 | Fig-specimg idl.png (file) |  |
84 KB | An example of EOVSA multi-frequency images at a selected time (2017-08-21T20:21:15 UT) plotted in SSWIDL. | 1 |
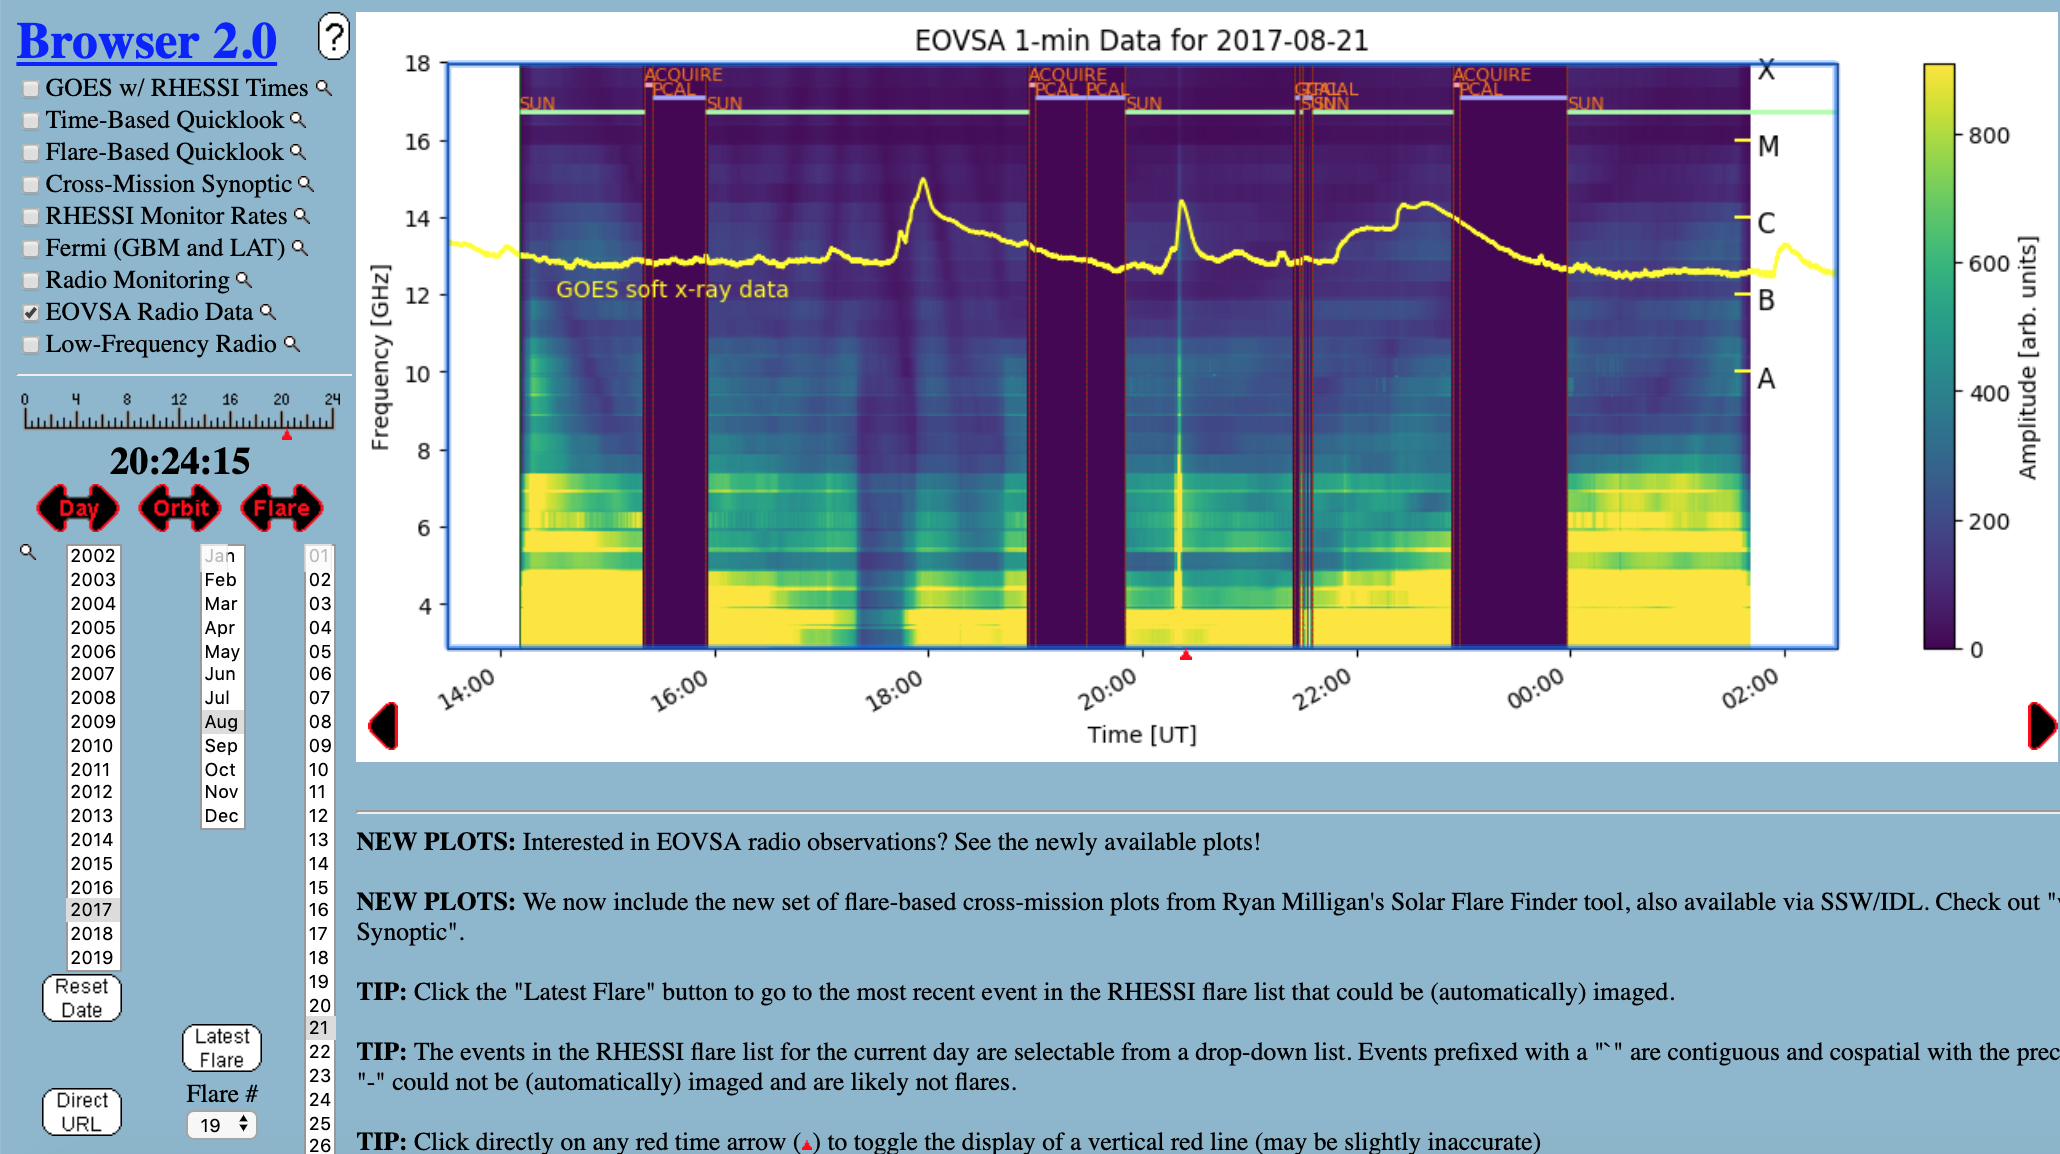
| 18:40, 15 May 2019 | Fig-browser.png (file) |  |
725 KB | Screenshot for viewing EOVSA all-day summary plot in RHESSI browser | 1 |
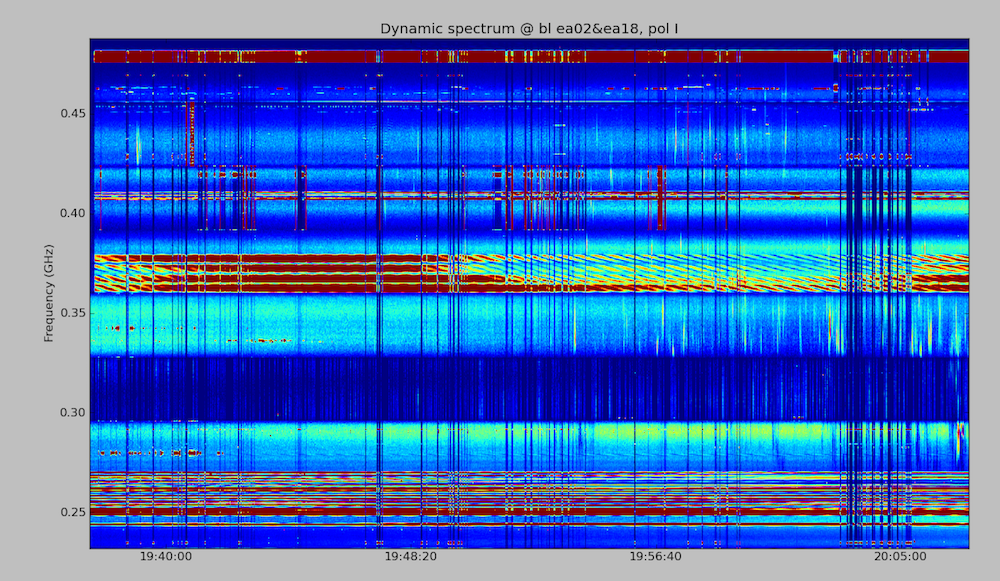
| 15:41, 5 October 2018 | VLA Pband 20181002.png (file) |  |
983 KB | Cross-power dynamic spectrum for VLA P band test observation on 2018 Oct 2. | 1 |
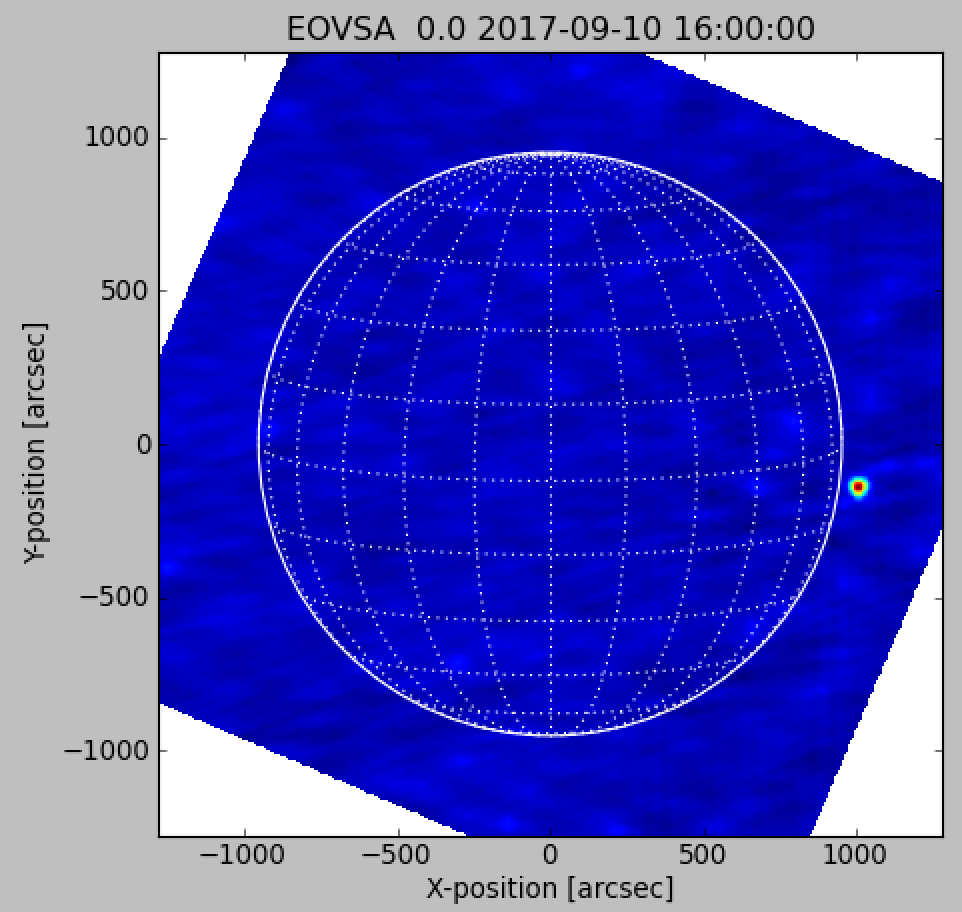
| 22:10, 3 January 2018 | Eovsa exampe flare image 20170910.png (file) |  |
240 KB | 1 | |
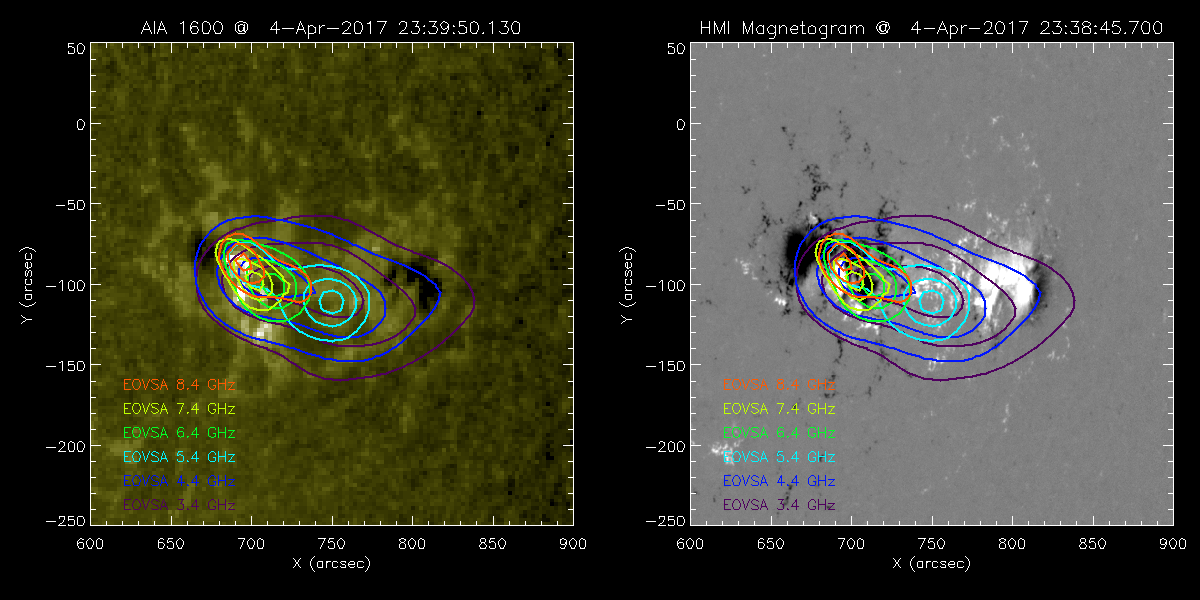
| 23:17, 18 May 2017 | Eovsa flare 20170404T233951.png (file) |  |
303 KB | 1 | |
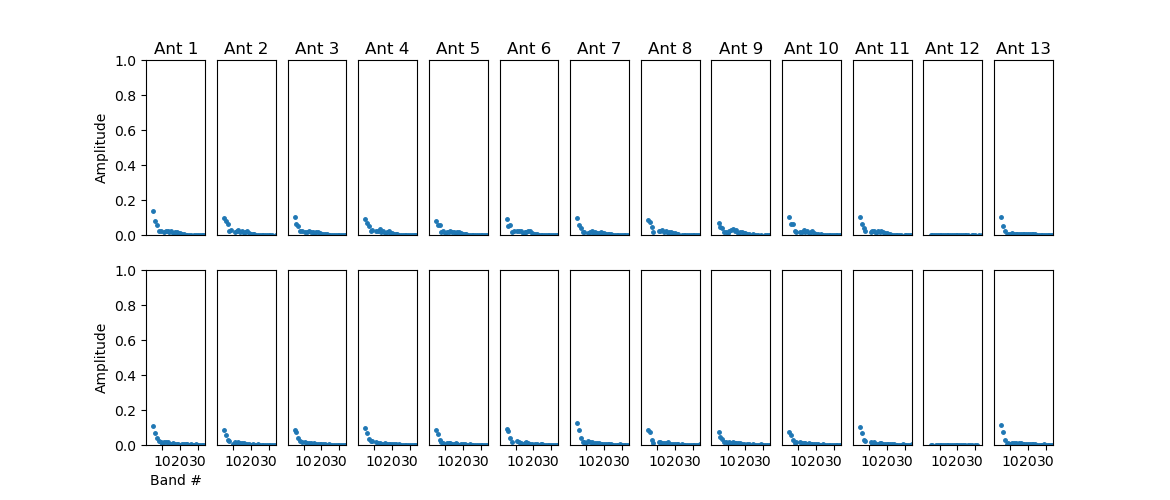
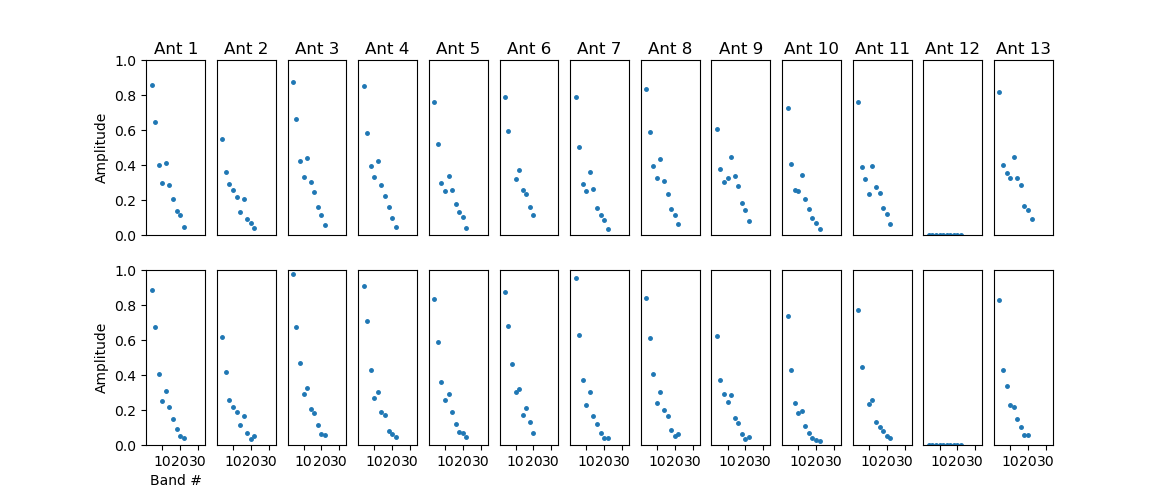
| 23:37, 16 May 2017 | 20170416 refcal amp.png (file) |  |
29 KB | 1 | |
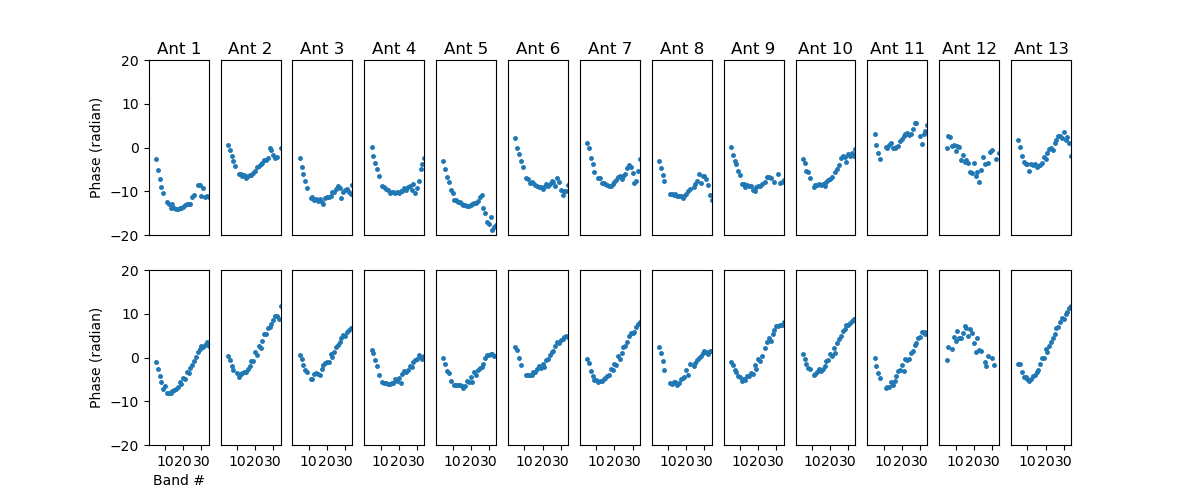
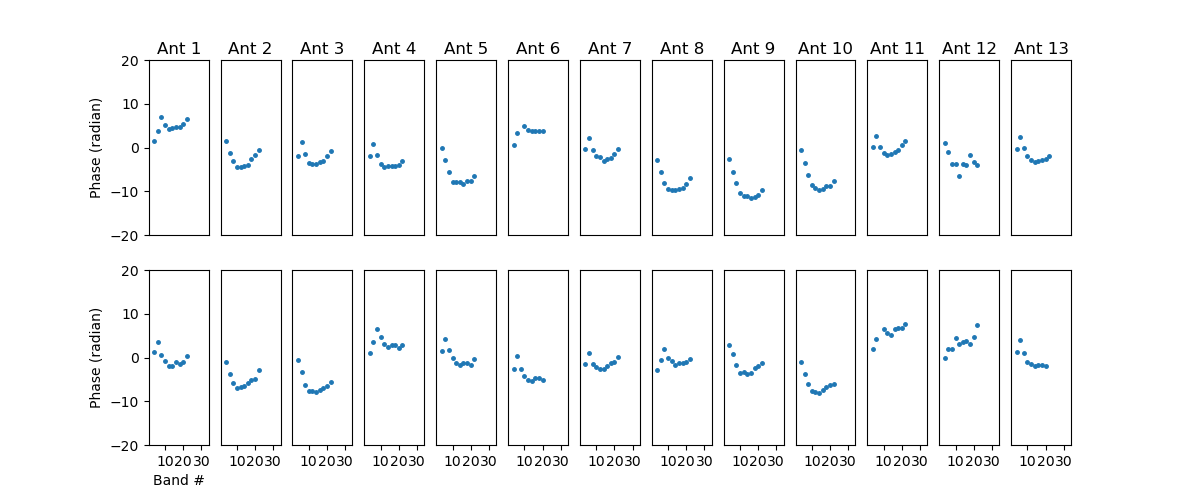
| 23:37, 16 May 2017 | 20170416 refcal pha.png (file) |  |
37 KB | 1 | |
| 20:43, 16 May 2017 | 20170410 refcal amp.png (file) |  |
27 KB | 1 | |
| 20:42, 16 May 2017 | 20170410 refcal pha.png (file) |  |
38 KB | 1 | |
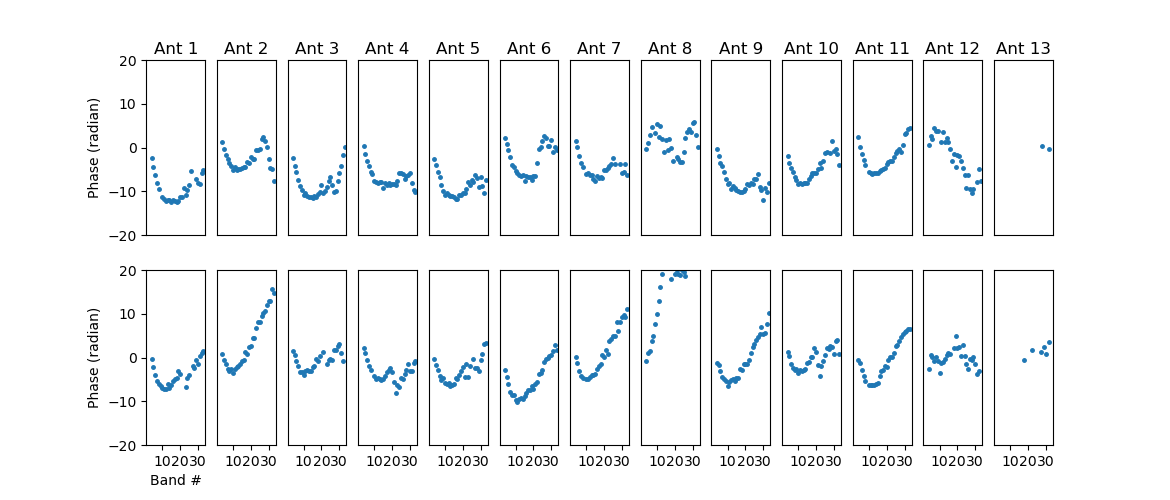
| 23:19, 15 May 2017 | 20170408 refcal pha.png (file) |  |
39 KB | 1 | |
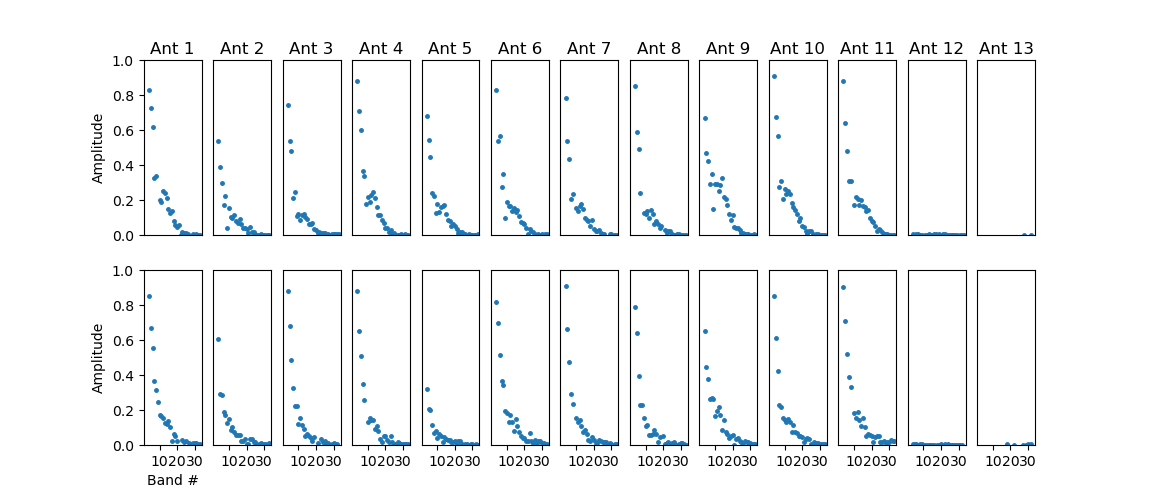
| 23:19, 15 May 2017 | 20170408 refcal amp.png (file) |  |
35 KB | 1 | |
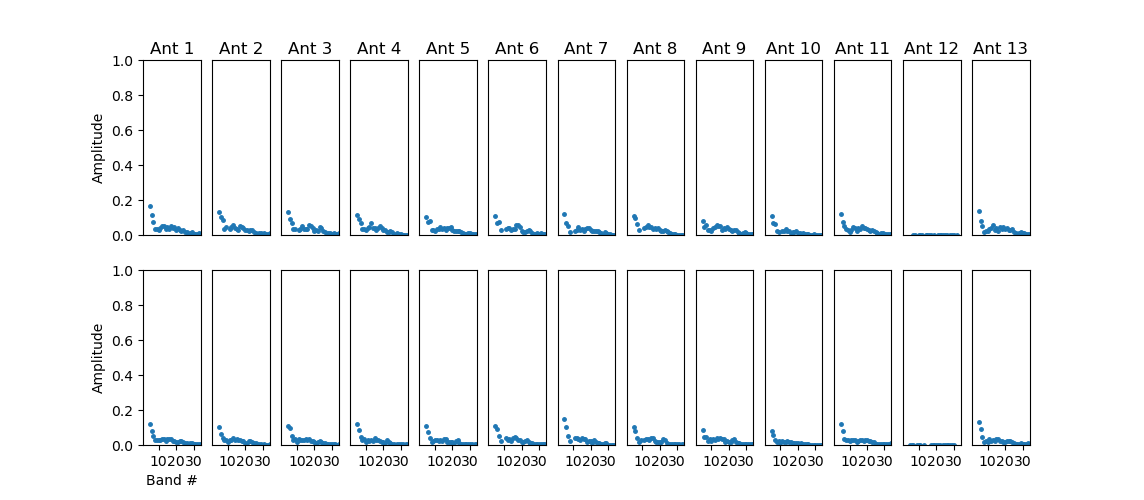
| 22:55, 15 May 2017 | 20170405 refcal amp.png (file) |  |
28 KB | 1 | |
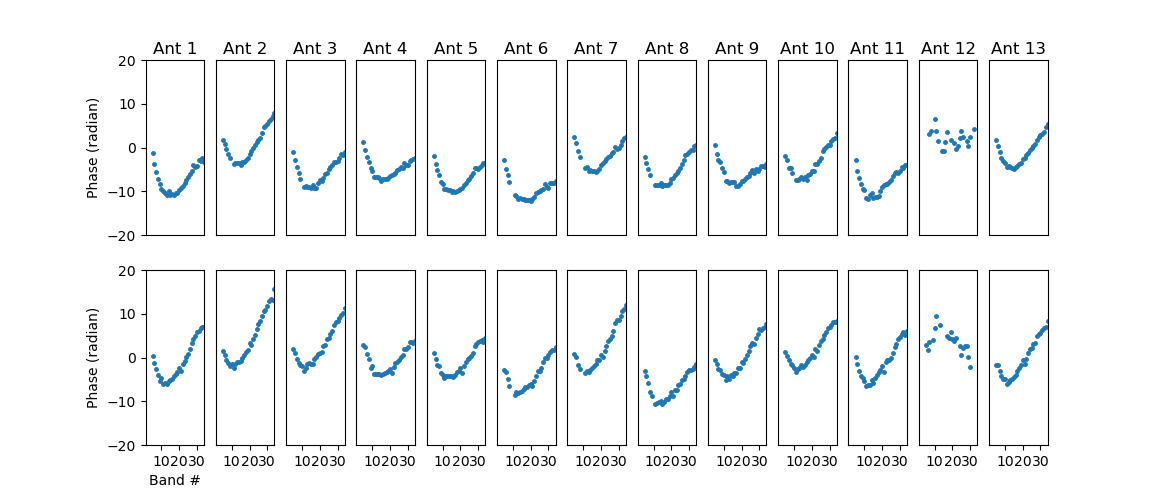
| 22:55, 15 May 2017 | 20170405 refcal pha.png (file) |  |
28 KB | 1 | |
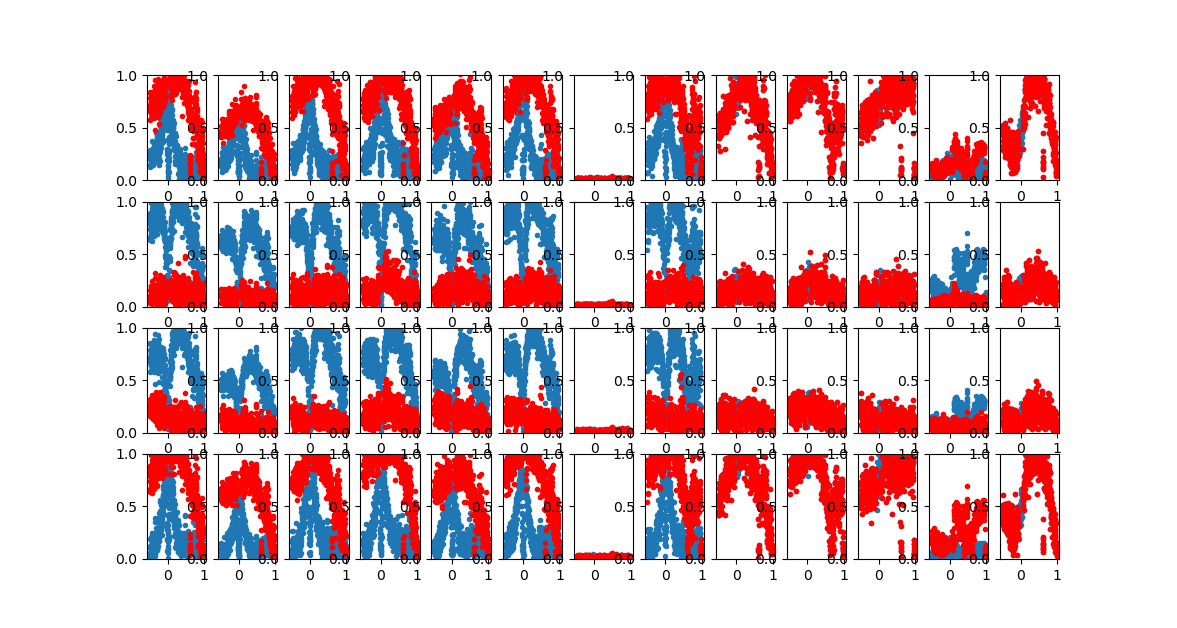
| 00:32, 6 January 2017 | Feed rot 20170104 3c84 corrected.png (file) |  |
169 KB | Amplitude vs. hour angle for all antennas (column) and polarizations (row; XX, XY, YX, YY). Blue is the original and red is the corrected. Observation was made on 2017 Jan 4 on 3C84. | 1 |
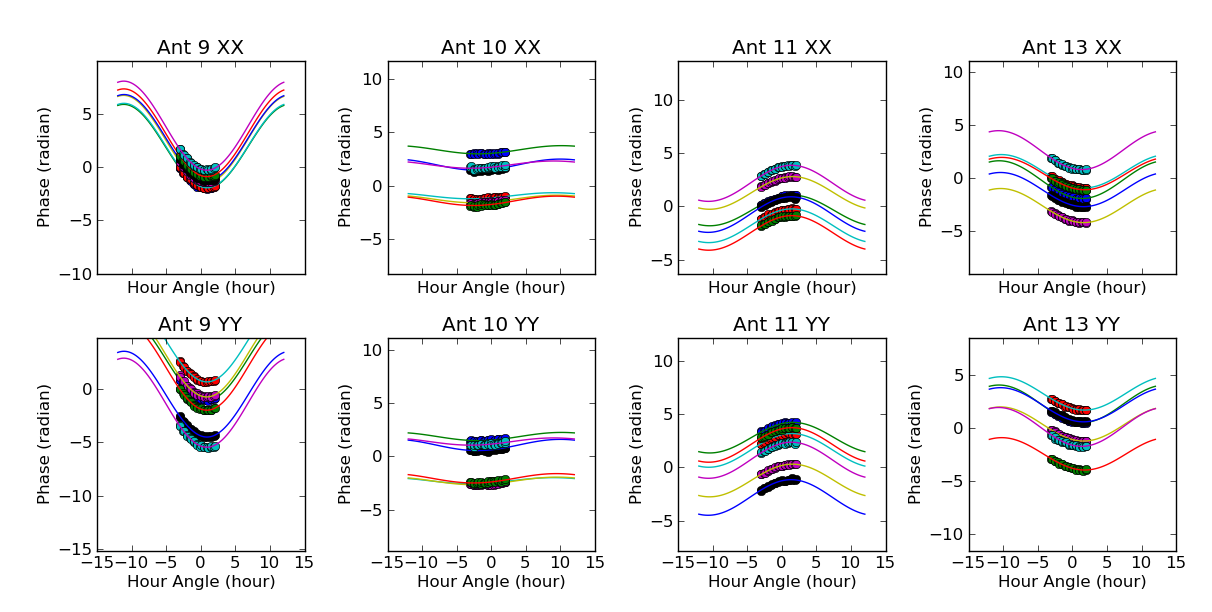
| 12:40, 20 November 2016 | Pha vs ha 2253+161 20161009 one fit.png (file) |  |
116 KB | Phase vs. hour angle for Antennas 9, 10, 11, 13 w.r.t. Antenna 14 at both XX and YY polarizations. This is based on an hour observation of 2136+006 (9.9 Jy at C band) and 2253+161 (10 Jy at C band) on 2016 Sep 7 under the fast frequency-sweeping mode o... | 1 |
| 12:37, 20 November 2016 | Pha vs ha 2253+161 20161009 independent fits.png (file) |  |
125 KB | Phase vs. hour angle for Antennas 9, 10, 11, 13 w.r.t. Antenna 14 at both XX and YY polarizations. This is based on an hour observation of 2136+006 (9.9 Jy at C band) and 2253+161 (10 Jy at C band) on 2016 Sep 7 under the fast frequency-sweeping mode o... | 1 |
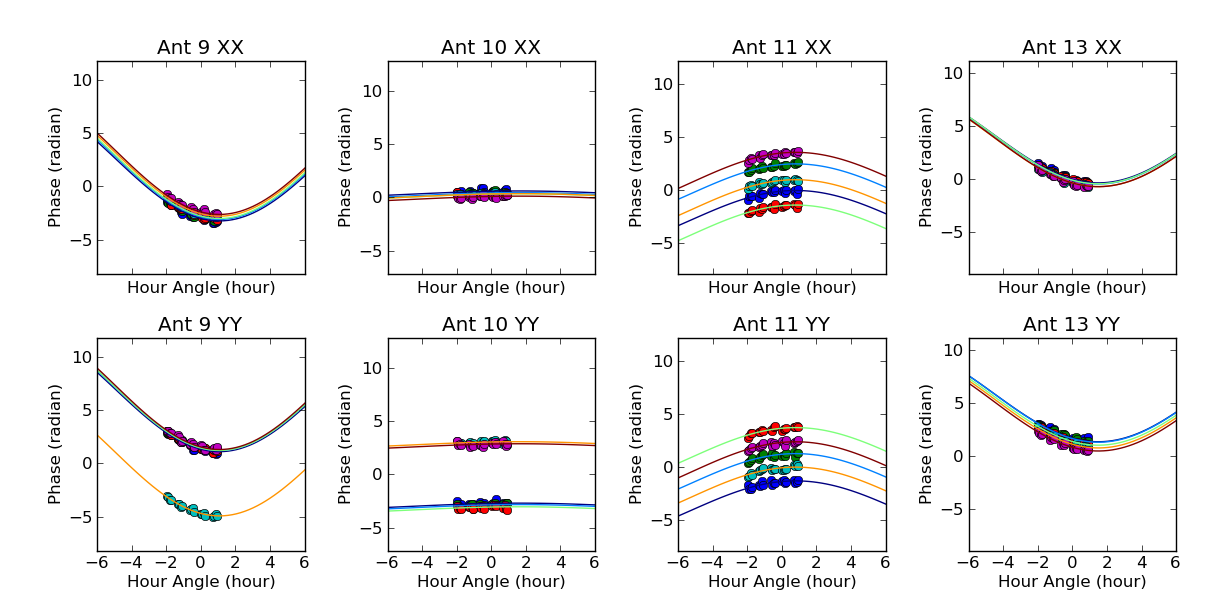
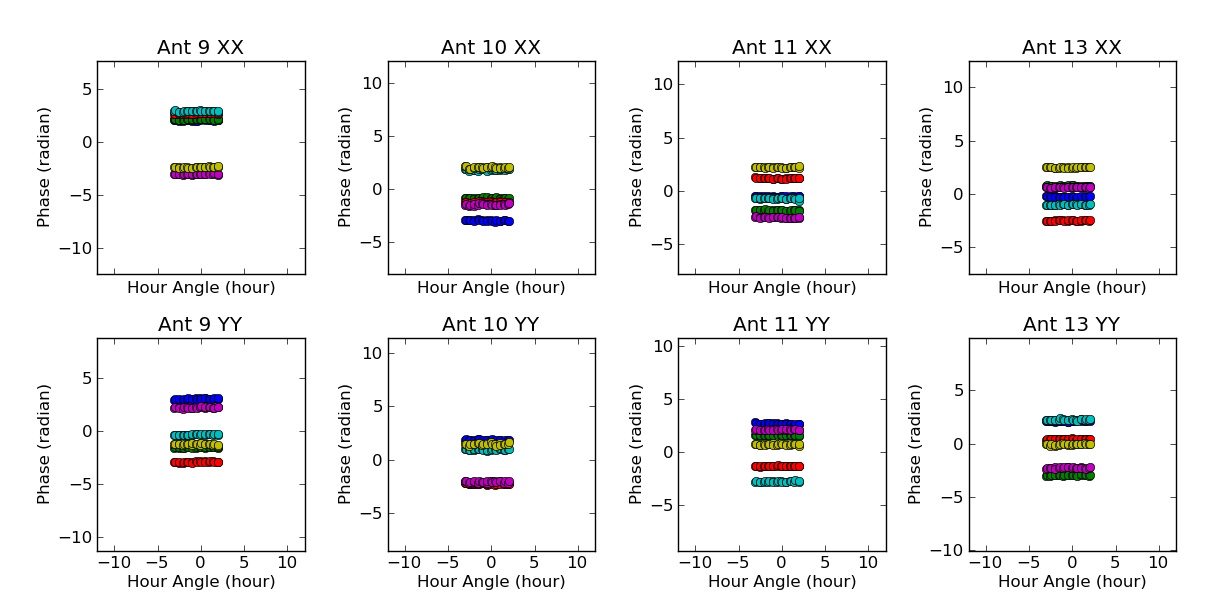
| 12:02, 20 November 2016 | Pha vs ha 0319+415 20160907 corrected.png (file) |  |
71 KB | Corrected phase vs. hour angle for Antennas 9, 10, 11, 13 w.r.t. Antenna 14 at both XX and YY polarizations. This is based on a ~5.5 hour observation of 3C84 on 2016 Sep 7. Different colors represent measurements/fits at different frequency channels. | 1 |
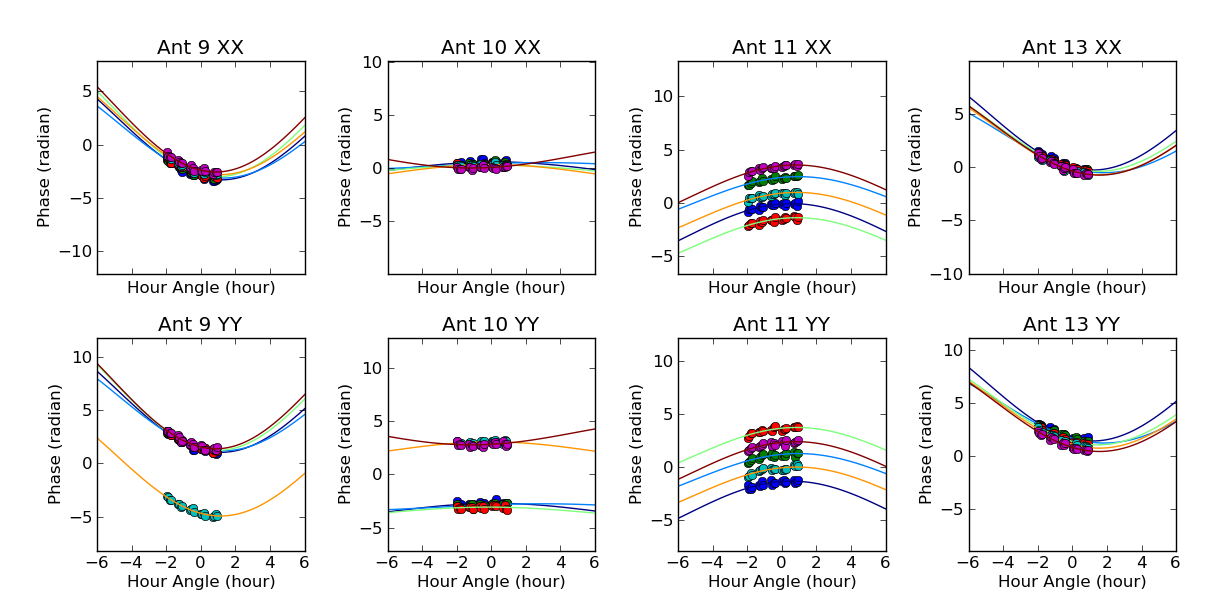
| 20:55, 19 November 2016 | Pha vs ha 0319+415 20160907.png (file) |  |
145 KB | Phase vs. hour angle for Antennas 9, 10, 11, 13 w.r.t. Antenna 14 at both XX and YY polarizations. This is based on a ~5.5 hour observation of 3C84 on 2016 Sep 7. Circular symbols are measured phases and curves are the corresponding sinusoidal curves.... | 1 |
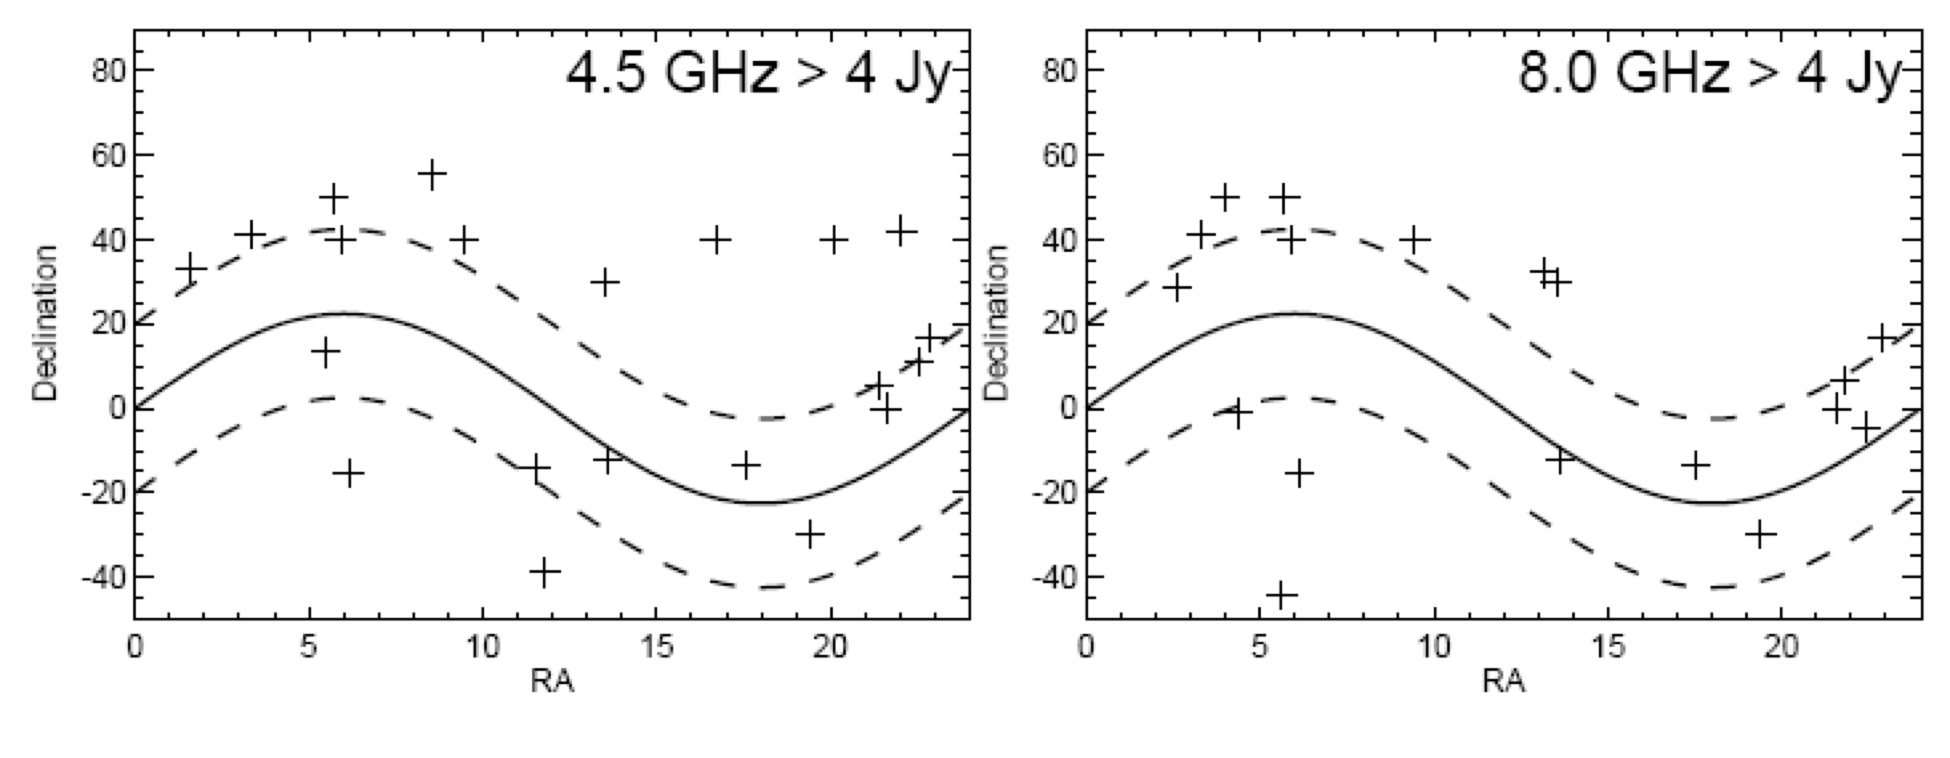
| 14:53, 24 September 2016 | Eovsa calib sources.jpg (file) |  |
134 KB | 1 | |
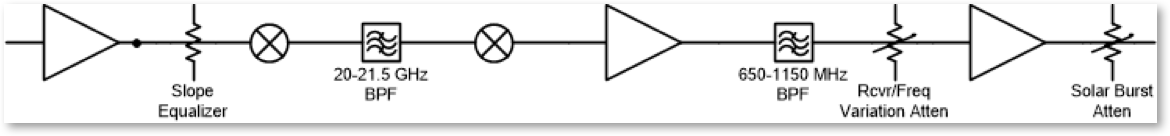
| 01:24, 5 August 2016 | Eovsa down converter block.png (file) | 40 KB | Block diagram of down-converter system | 1 | |
| 01:23, 5 August 2016 | Eovsa correlator block.png (file) |  |
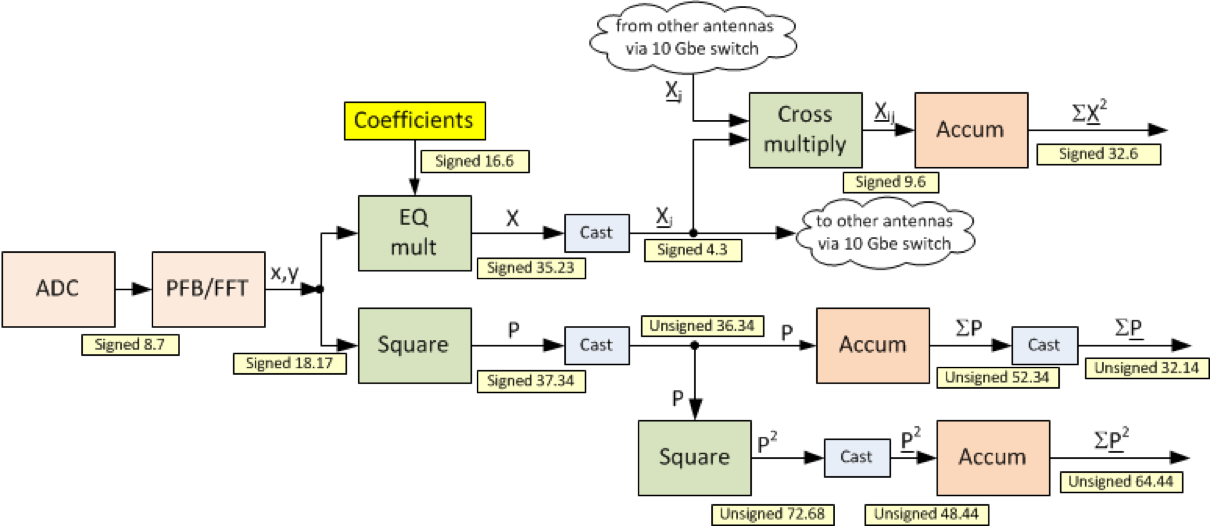
131 KB | block diagram of digital correlator | 1 |
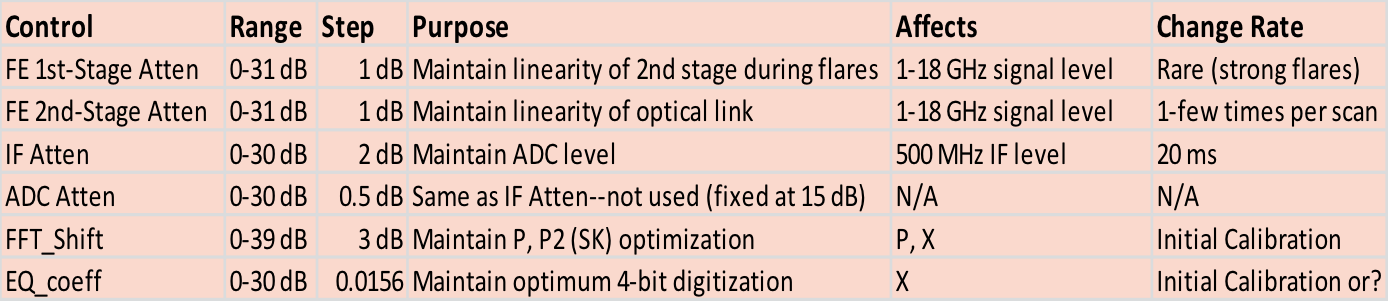
| 01:22, 5 August 2016 | Eovsa gain controls.png (file) | 103 KB | Summary of EOVSA gain control "knobs" | 1 | |
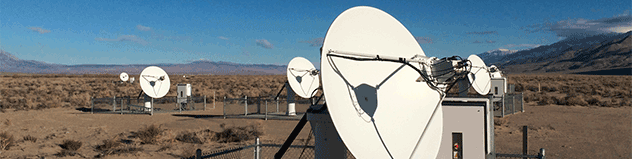
| 00:56, 5 August 2016 | Eovsa1.png (file) | 45 KB | EOVSA photo from array center | 1 |