Owen's Notes: Difference between revisions
| Line 115: | Line 115: | ||
=== Stateframe Display === | === Stateframe Display === | ||
The Stateframe display shows the current status of the system as shown below: | |||
[[File:Sf_display.png]] | |||
There are problems with any antennas or systems that are highlighted in red. Lines that are marked in yellow designate a warning, but may not be critical. | |||
Lines marked in purple are collapsible sections. Clicking on them will expand or collapse the section. | |||
The tabs near the top of the display bring up different sections and enable graphs to be plotted. | |||
Note that the Log Stateframe box should be marked in blue. If there is a second Stateframe display running this box will be unmarked on the second display. | |||
=== Restarting the Stateframe Display === | |||
To restart the Stateframe display enter the following commands at a helios terminal: | |||
:<p style="font-family:courier">cd ~/Dropbox/PythonCode/Current</p> | |||
:<p style="font-family:courier">screen</p> | |||
:<p style="font-family:courier">python /common/python/current/sf_display.py &</p> | |||
Press <CRTL>AD to exit from screen. | |||
Note that it will take several minutes for the display to come up. | |||
== Phase Calibrations (23 March 2020) == | == Phase Calibrations (23 March 2020) == | ||
Revision as of 17:10, 13 August 2020
Routine Tasks
Daily Tasks
Check the following pages:
http://ovsa.njit.edu/status.php (the all-day plot from the previous day is at the bottom of the page)
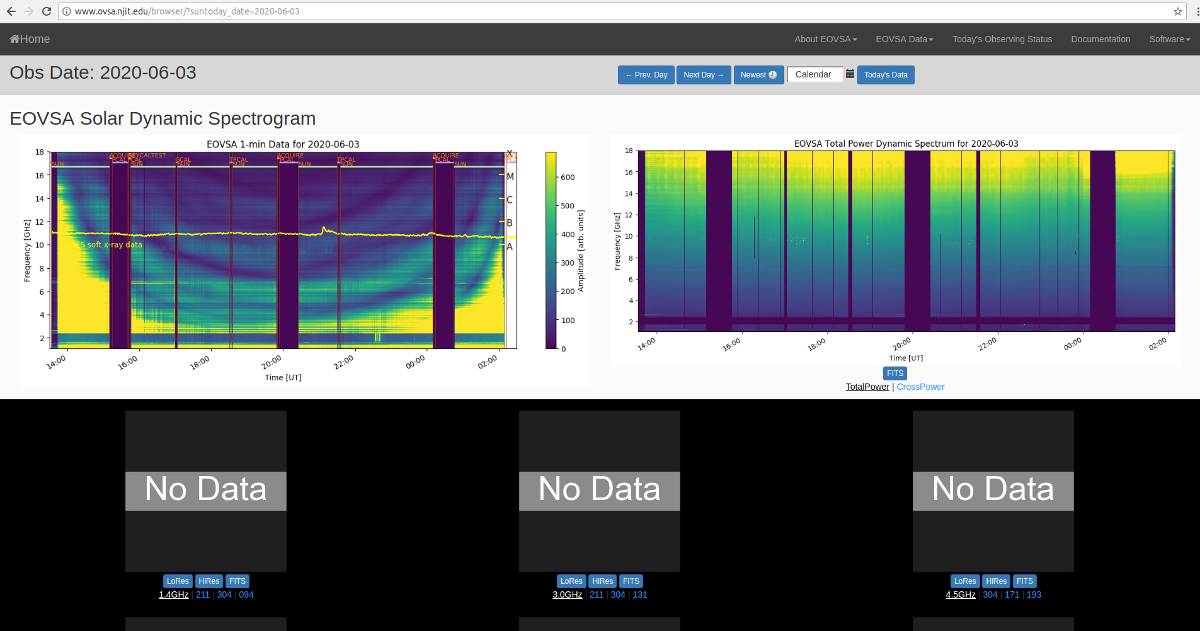
http://www.ovsa.njit.edu/browser/ (this defaults to showing pipeline output from two days previous)
http://ovsa.njit.edu/pointing/ (the latest pointing plot(s) at the bottom)
http://ovsa.njit.edu/phasecal/ (the latest phasecal vs. frequency is somewhere in the middle, i.e. the bottom of the list of pcf*.png files).
http://ovsa.njit.edu/EOVSA/ant_status.php (Current antenna status).
Ensure that the schedule is running and that the stateframe is updating.
Check that the data files are being updated. Goto the user@dpp terminal and type:
ls /data1/IDB |tail
Perform a Phase Calibration
Check that the network monitoring function (fix_packets()) is working on the DPP. It can also be seen as dropouts on the spectrogram (http://ovsa.njit.edu/status.php).
If there are any problems with any of the antennas goto http://ovsa.njit.edu/EOVSA/ant_status/ant_status_form.php and fill out the appropriate form.
Weekly Tasks
Perform a Gain Calibration
Monthly Tasks
Perform a Pointing Calibration
Remote Login (23 March 2020)
Helios Login
The computers can be accessed remotely using SSH and VNC. Since I use Linux (Ubuntu) these instruction are for that OS.
To VNC into Helios, open a terminal and type the following command:
ssh -L 5902:helios.solar.pvt:20000 oweng@ovsa.njit.edu
I then open Remmina Remote Desktop Client. Make sure VNC is selected at the top left. Type in:
localhost:2
and enter the password when prompted.
The Helios display should now be visible.
Occasionally, the VNC connection will be lost. If this occurs the following procedure need to be performed.
From a new terminal window type:
ssh -L 8887:helios.solar.pvt:22 oweng@ovsa.njit.edu
From another terminal issue the command:
ssh -p 8887 sched@localhost
Now type in:
x11go
Now restart the VNC client.
Pipeline login
To log in to pipeline, from a terminal enter the command:
ssh -L 8888:pipeline.solar.pvt:22 oweng@ovsa.njit.edu
Then from a new terminal enter:
ssh -p 8888 user@localhost
Win1 login
To log in to the win1 machine, from a terminal enter the command:
ssh -L 8889:win1.solar.pvt:5900 oweng@ovsa.njit.edu
Then from a new VPN client enter the hostname:
localhost:8889
Helios Displays
Schedule Window
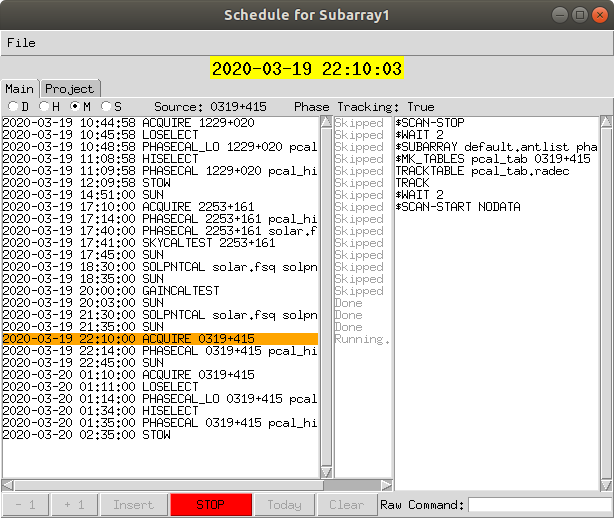
The Schedule window shows the currently running schedule as shown below.
The left side of the window shows each of the scripts that is to be run. The orange bar shows the task that is currently being run.
The right side of the window shows each command that is to be run in the current script.
At the bottom of the window are a series of buttons. The STOP button will stop at the current script. Once stopped, the remaining buttons will become active. To restart the schedule click on the GO button.
Starting the schedule window
If the schedule window gets closed it will need to be restarted. Follow the procedure below:
From a helios terminal enter the following commands:
cd ~/Dropbox/PythonCode/Current
screen
python /common/python/current/schedule.py &
Press <CRTL>AD to exit from screen.
Stateframe Display
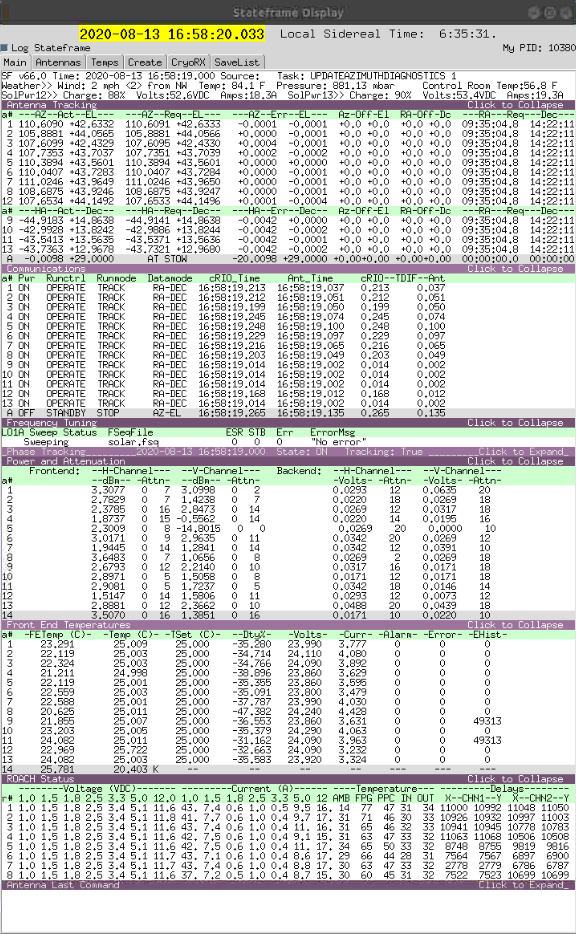
The Stateframe display shows the current status of the system as shown below:
There are problems with any antennas or systems that are highlighted in red. Lines that are marked in yellow designate a warning, but may not be critical.
Lines marked in purple are collapsible sections. Clicking on them will expand or collapse the section.
The tabs near the top of the display bring up different sections and enable graphs to be plotted.
Note that the Log Stateframe box should be marked in blue. If there is a second Stateframe display running this box will be unmarked on the second display.
Restarting the Stateframe Display
To restart the Stateframe display enter the following commands at a helios terminal:
cd ~/Dropbox/PythonCode/Current
screen
python /common/python/current/sf_display.py &
Press <CRTL>AD to exit from screen.
Note that it will take several minutes for the display to come up.
Phase Calibrations (23 March 2020)
Phase calibrations are to be performed every day when possible.
Reference Calibration
Before the phase calibration can be done, a reference calibration needs to e performed, which will be subsequently used as the reference for the phase calibration.
Access the Helios computer.
On the terminal window make sure that the ipython: /home/user tab is selected.
There should be a prompt as follows: pipeline:~>
At the prompt type the following command:
python /common/python/current/calwidget.py
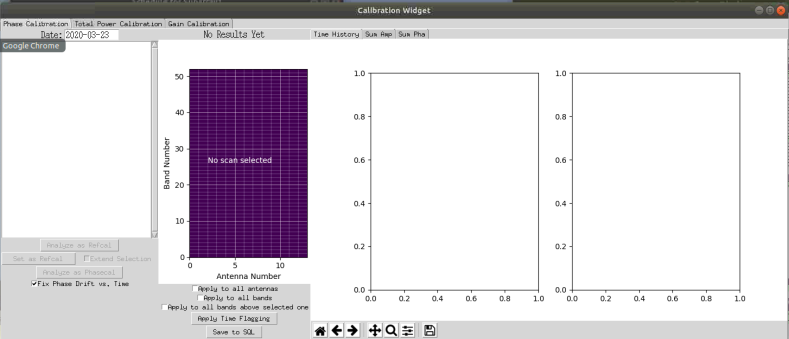
The following window will open up:
In the date box near top right of the window type in or use the up and down arrows to select the previous days date and hit enter.
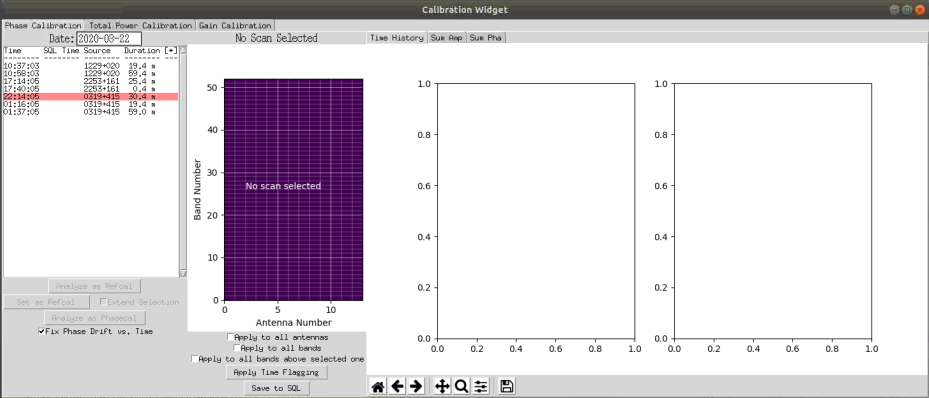
Click on the first available scan that does not suffer from a Windscram. Windscrams are marked in red. If a windscram occurred for less than 20% of the scan then it will be marked in yellow and may still be usable. The example below shows a windscram at 22:14:05.
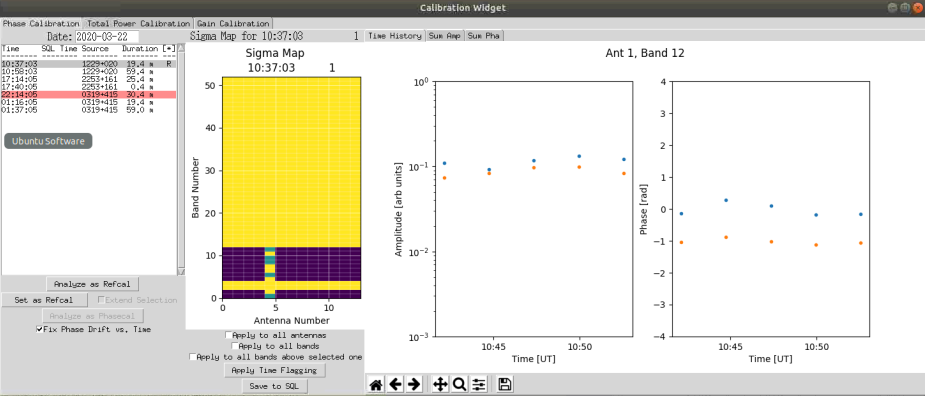
Select the earliest calibration that does not have a windscram, and then click on 'Analyze as Refcal'. The Sigma map should now be populated as shown below:
The above chart is for the low-band (channels 1 to 12). Yellow blocks indicate bad or unavailable data. Bands 3 and 4 are excluded due to intense RFI at these frequencies. Antenna 5 currently is not operating well, and will be excluded from any analysis. The green blocks indicate that the data may be alright if some points are excluded. Purple blocks indicate the data is good.
Also shown in the above plot is the power and phase for Antenna 1 and band 12. The blue points are the X-polarization and the orange points are the Y-polarization. These should be close to straight lines.
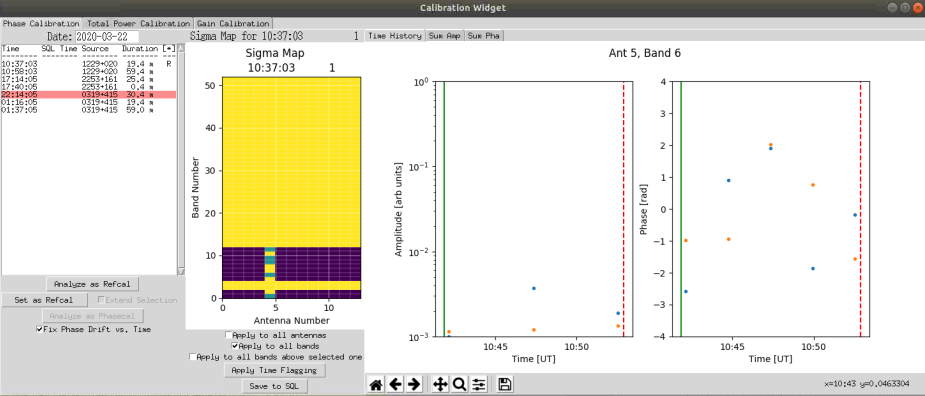
In this case we need to exclude all of Antenna 5 from the calibration. First click on any block for antenna 5 in the range of band 1 to 12. Next check the box 'Apply to all bands'. Move the mouse over to either the Power or Phase plots (either works). We need to exclude all points. Move the mouse slightly before the first point in the chosen plot and press the 'A' key. A green line will appear. next move the mouse slightly past the last point and press the 'B' key. A red line will appear. The screen should look like the figure below.
Now click on 'Apply time flagging. All of antenna 5's bands should turn yellow.
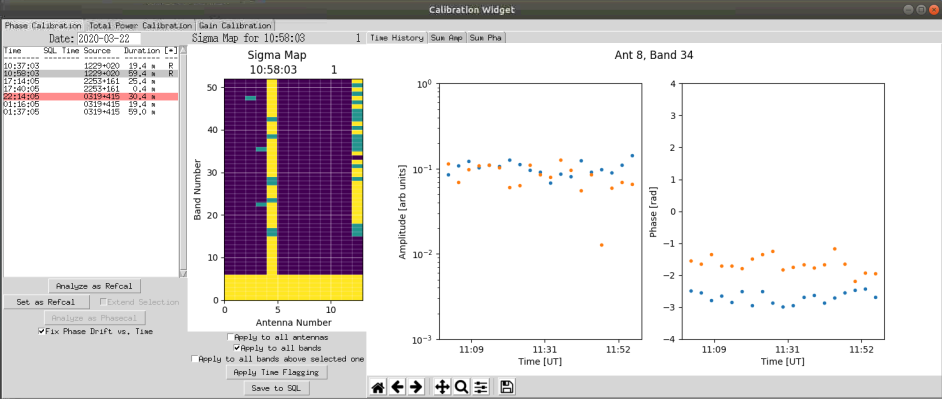
Once complete, select the associated high band calibration and then click on 'Analyse as refcal'. In this case bands 7 to 52 will be shown on the sigma map as shown in the figure below.
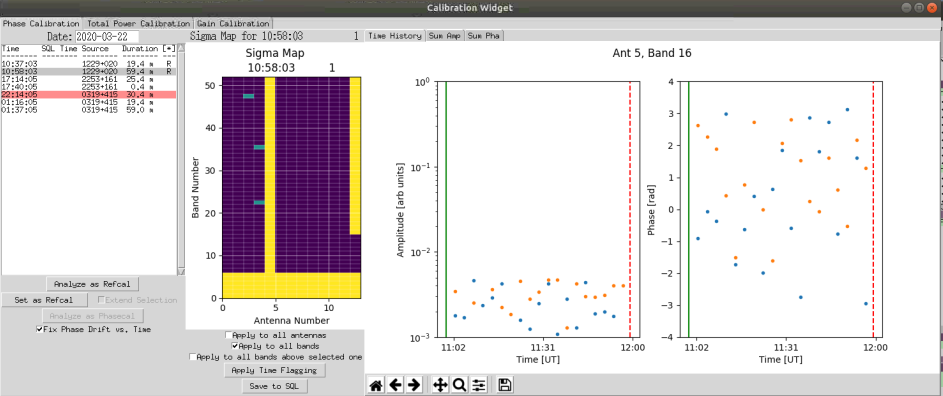
Antenna 5 once again needs to be excluded using the procedure described above. In addition antenna 13 has problems from band 13 to 52. We will remove these channels from the analysis. Ensure 'Apply to all bands is unchecked and select 'Apply to all bands above selected one'. Select band 13. As before select all of the points by pressing 'a' and 'b' at the appropriate points (start and end of the plot). Click on 'Apply Time Flagging'. All of the bands from the selected band up should turn yellow as shown in the figure below.
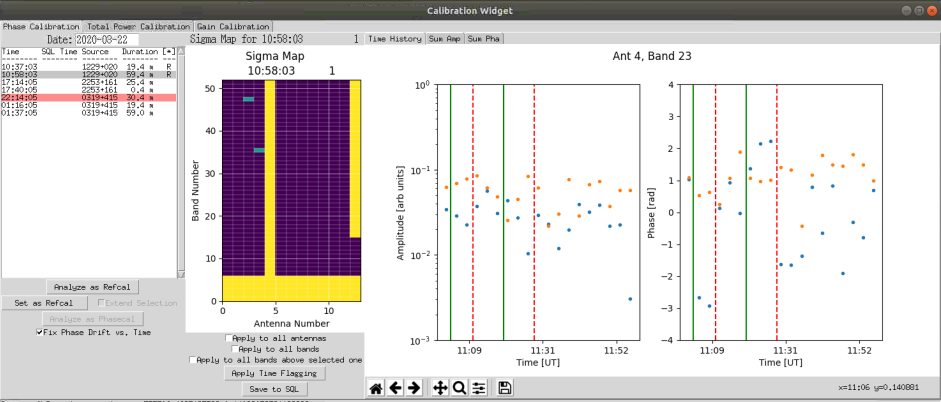
As can be seen, there are still 3 green squares. We can make these good by selecting each one and flagging bad samples. In this example I have selected Antenna 4, Band 23.
Ensure all checkboxes are unchecked. Slelect the box for the antenna and band the you wish to time flag. select (using mouse and a and b keys) up to two ranges of points to exclude. pressing the x key will remove the most resent line chosen. Once you have flagged the ranges, click on 'Apply Time Flagging'. Hopefully the box will turn purple. If not you may need to select different ranges.
The result of this procedure is shown below.
Repeat this procedure for the remaining bad antennas and bands.
Once completed, select one of the bands of the refcals from list on the left and then click on 'Set as Refcal'. The click on extend selection. NOw select the other refcal. Make sure both are highlighted. Click on 'Set as extended refcal'. Click on 'Save to SQL'.
Phase Calibration
After the reference calibration has been done, the phase calibration can be performed. Click on a good calibration for the high band (one that has not had a windscram and has a reasonable duration). Not that Phase Cals are not performed using the low band.
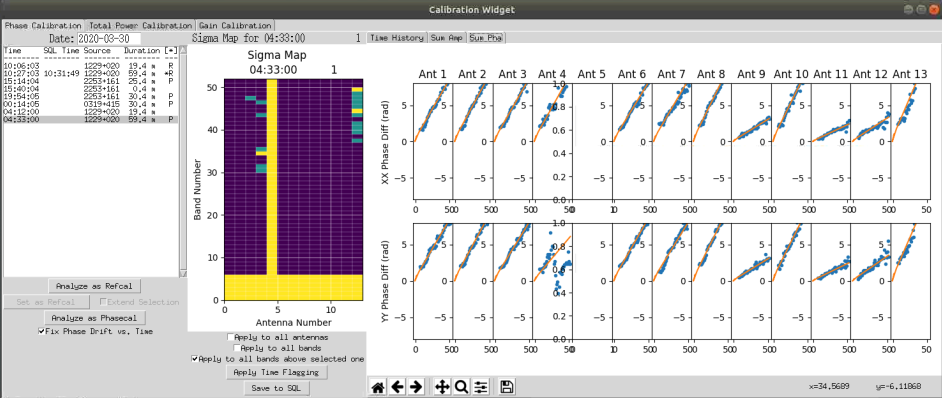
Then click on 'Analyze as Phasecal'. At the top of the screen click on the 'Sum Pha' tab. The important thing here is that the slopes look good. Below is an example display of the slopes. These slopes are with reference to the Refcal.
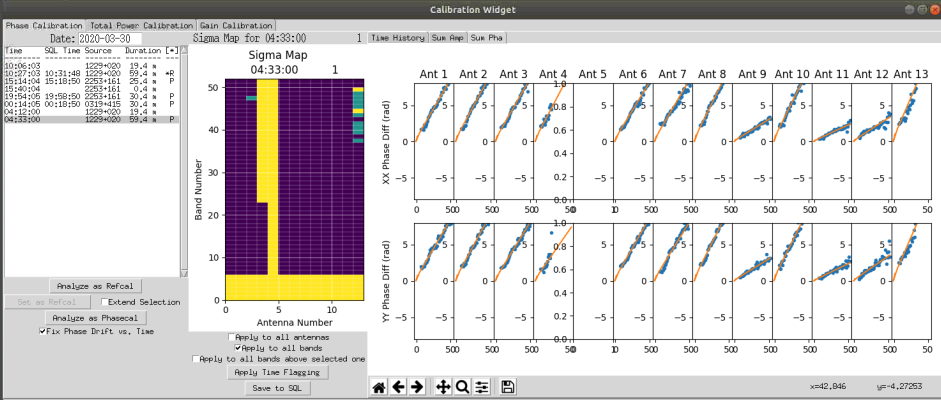
In the above display, we can see that all of the slopes look good except for Antenna 4. note that we have excluded Antenna 5 from the observations as these have no reference cal. By moving the mouse over points on antenna 4 the channel is displayed as the x value in the bottom right of the window. In this case, channel 24 and above will be excluded. Ensure 'Apply to all bands above selected one' is checked and click on the antenna 4 and channel 24 box. Select all points and click on 'Apply time flagging' Once done, click on the 'Sum Pha' tab again to ensure the slope now looks okay (See figure below). Once satisfied click on 'Save to SQL'.
System Gain Calibration (30 April 2020)
This procedure is designed to adjust the system gains. This should be performed weekly or whenever the calibrations become poor. The full details can be found at EOVSA System Gain Calibration. The steps below are a summary of that page.
The best time to perform this calibration is immediately after a Solar Point Calibration, as the antennas need to be taken off the sun.
The dBm values in the power and attenuation section of the Stateframe display should be between 1 and 4.
Initially click on the Stop button in the schedule window.
From the Schedule window issue the following commands:
$scan-stop
stow
femauto-off
femattn 0
$fem-init
Wait approximately 30s for the new settings to update. Then proceed with:
dcmauto-off ant1-14
$capture-1s dcm
Click on the Clear button and then the Go button.
From a pipeline terminal issue the following commands
ipython --pylab
import roachcal
tbl=roachcal.DCM_calnew('/dppdata/PRT/PRTyyyymmddhhmmssdcm.dat',dcmattn=10,missing='ant15')
In the above command yyyymmddhhmmss is the year, month, day, hour minute and second of the dcm file. Pressing tab will complete the filename. for the missing field, antenna 15 must be included. Add any other antennas that are not to be included on the gain calibration separated by spaces.
Enter
tbl
to view the contents of the tbl variable that was just created.
Band 1 has recently had bad attenuations. To use older good values for this band issue the command:
tbl = roachcal.override(tbl, bandlist=[1])
Other bands can be excluded by adding the bands to the bandlist (space separated).
It is useful to compare the new table with an existing table to check for errors/glitches. To do this issue the command:
roachcal.compare_tbl(tbl, t=Time('2020-05-08'))
Replace the time with the previous days gain calibration. All of the differences should be close to zero.
Finally:
import cal_header
cal_header.dcm_master_tablesql(tbl)
From the Schedule window click the Stop button and then the Go button.
In the schedule command box enter the command
$scan-start
Total Power Calibration
The Power calibration is performed whenever components are replaced in the receiver. For a description of how to service the receiver see [[1]].
Setup
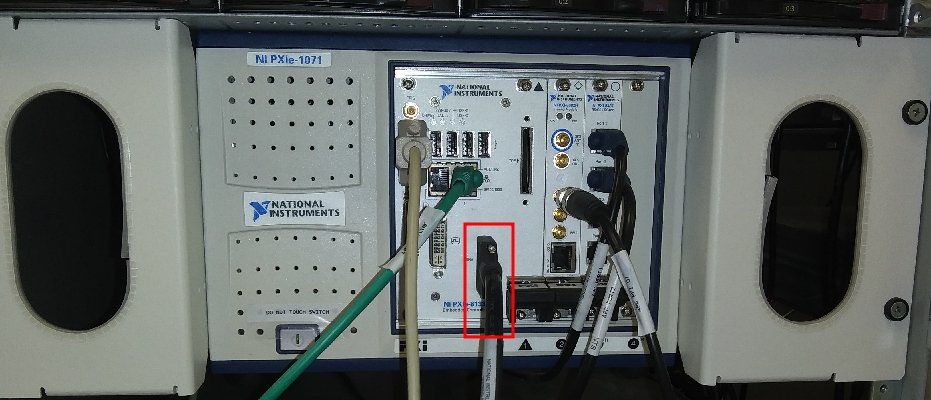
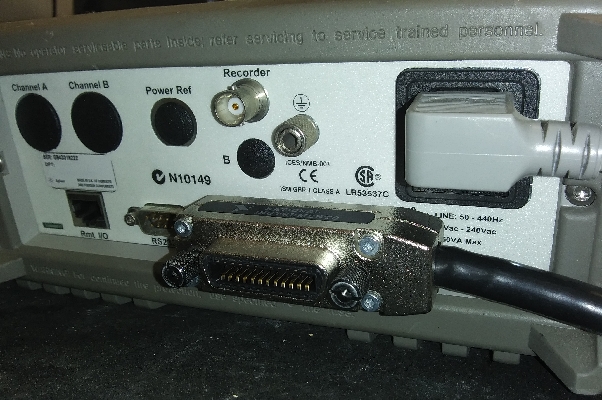
Connect the power meter to the receiver as described here [2].
Find the GPIB cable and connect it to the ACC. Run the cable into the lab and connect it to the power meter.
Performing the Calibration
Access the windows (win1) computer.
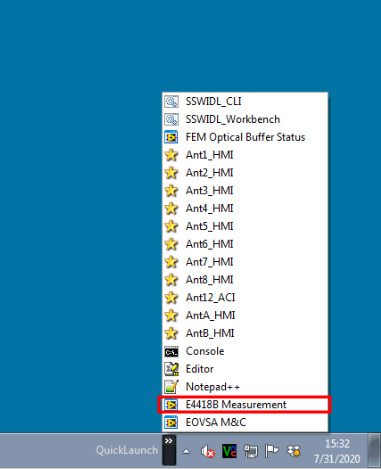
From the Quicklaunch menu select the E4418B Measurement program.
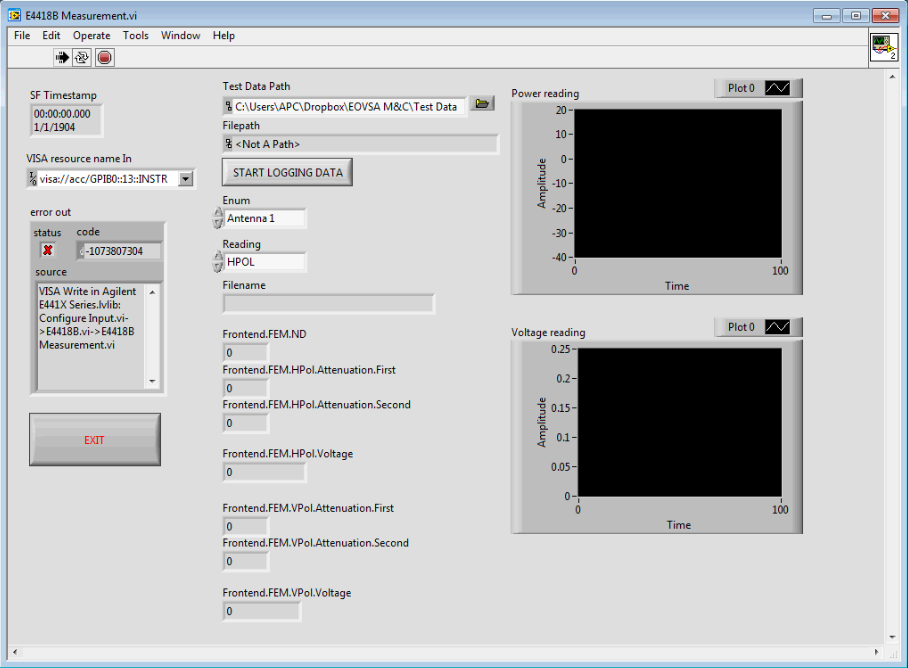
This should bring up a screen as shown below:
Change Enum to the appropriate antenna number.
Change Reading to the appropriate polarisation.
From the Helios computer open up the gedit program.
Open the file /home/sched/Dropbox/PythonCode/Current/FEMbenchtest.scd
Edit the first line so that the correct antenna is present. For example, if antenna 5 is to be calibrated then the first line should read similar to:
1 2019-11-08 12:07:00 FEMBENCHTEST ant5
Once edited, save and close the file.
On the Schedule window click on Stop.
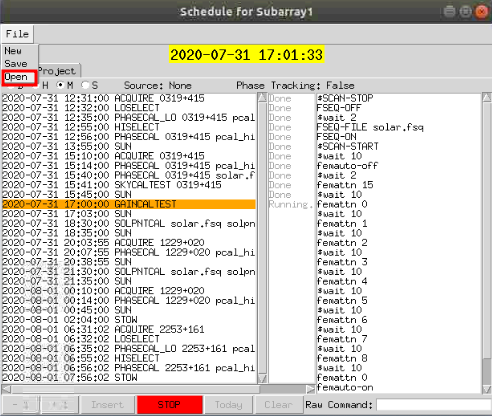
Click on File and then Open
Select the /home/sched/Dropbox/PythonCode/Current/FEMbenchtest.scd file and open it.
Click on Today
From the Window computer, on the E4418B program click on Start Logging Data
The computer should go through four sequences which display 4 block patterns on the plots in the E4418B program.
Once completed click on Stop
Repeat for the other polarisation if required.
Remember to reload and restart the Solar.scd schedule.
Loading the Calibration to the CRIO
The files created are located in the Dropbox/EOVSA M&C/Test Data/ folder.
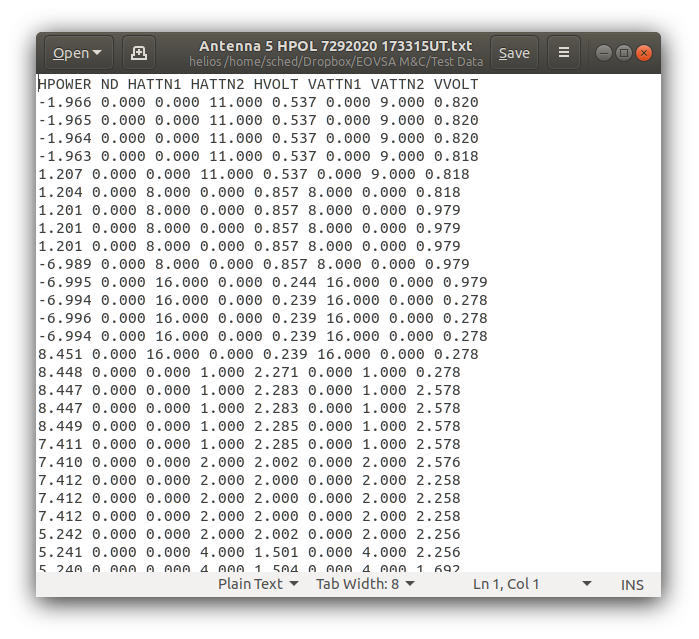
Find the most recently created text files and open the first of them in a text editor. An example of a part of the file is shown below:
This file need to be edited to remove all but one of the 5 lines for each attenuation. Typically choose the third entry in each data block.
Once the file has been edited and saved, from pipeline change to the folder where the edited files are located.
From ipython, enter the following commands:
import fem_cal as fc
import crio
fc.fem_cal(ant)
where ant is the antenna number for the particular calibration.
The latest files for that antenna will be read, and a plot will appear for each polarization with both points and quintic fit. The parameters of the fits will be printed to the screen in a form that can be cut and pasted directly into the crio.ini file for the appropriate antenna
To retrieve the crio.ini file for a given antenna issue the following command in ipython:
crio.save_crio_ini(ant_str='ant#')
where # is the antenna number. Press CRTL Z to exit ipython temporarily.
Open the downloaded ini file in a text editor and copy the new coefficients into this file. Enter fg to get back into ipython.
Finally enter the command
crio.reload_crio_ini(ant_str='ant#')
Update Antenna Pointing (17 March 2020)
Access the Pipeline Computer.
From the terminal, start ipython:
ipython --pylab
Import the calibration and Time libraries:
import calibration as cal
from util import Time
Load up the solar pointing scans for a given date and time.
x,y,qual=cal.solpntanal(Time('2020-03-17 18:30'))
The above command will load the scans from the 17 March 2020 18:30 UT.
To view the beam widths as a function of frequency for each antenna and polarisation:
cal.sp_bsize(x,y)
To obtain the pointing offsets:
xoff,yoff,dx,dy=cal.sp_offsets(x,y)
This will display the offsets for each antenna and feed. Ideally the offsets should be at zero. If particular antennas significantly deviate from zero then a correction can be made.
For example, the following command will adjust the pointing offsets for antennas 6 to 8, 10 and 13:
cal.offsets2ants(Time('2020-03-17 18:30'),xoff,yoff,ant_str='ant6 ant7 ant8 ant10 ant13')
The newer antennas with the alt-az drives that have had tracking updated will need to be rebooted. From the Schedule Window issue the commands:
reboot 1 ant6-8
tracktable sun_tab.radec 1 ant6-8
track ant6-8
The antenna pointing adjustment is typically performed once per month.
Antenna Trouble Shooting (2 April 2020)
If an antenna in the State-frame Antenna Tracking section is highlighted red, it will need to be restarted.
In the state-frame display, click on the antenna display and then click on the tab for the appropriate antenna.
One or both of the Permit boxes will probably be red. The left column is for azimuth and the center column is for elevation. The procedure for Az and El is slightly different.
Access the windows computer.
Click on then Quick launch icon at bottom right and then click on the antenna that is problematic.
Click the Enable checkbox. The Drives On, Operate, Energized and Break off should all be green.
If the Permit lights are red the click Reboot System.
The current time should be updating about every second (there may be brief pauses).
Click Exit.
If the Elevation Permit fails to become green then access the following page (make sure to replace vik5 with the appropriate antenna):
Turn the Antenna Relay on and wait for 10 seconds.
Turn the Relay off.
If the antenna still will not start goto the following webpage (make sure to replace ant5 with the appropriate antenna):
Click Login and then enter the username and password.
Click Parameters and the change Option 10.00 to 1070 and Option 10.38 to 100. Click on change.
Then click on logout.
After the above procedures are completed you will need to reload the track table. This is done from the State Frame display using the following commands (again ensure that ant5 is replaced with the appropriate antenna):
tracktable pcal_tab.radec ant5
track ant5
Antenna Communications Failure
If an antenna is highlighted in the Communications section of the State-Frame display then the following procedure can be used to correct it.
From the Schedule on Helios enter the command
$pcycle crio ant2
and wait about 2 minutes.
From the Schedule on Helios issue the command
sync ant#
where # is the antenna number.
If this does not resolve the communications problem, then proceed with the procedure below.
Access the win1 computer.
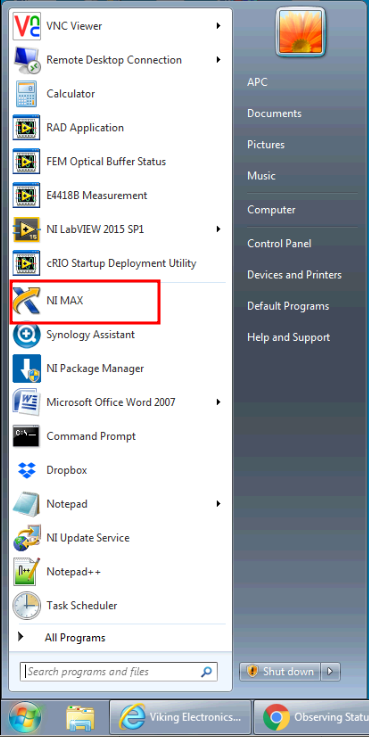
Click on Start then select NI Max.
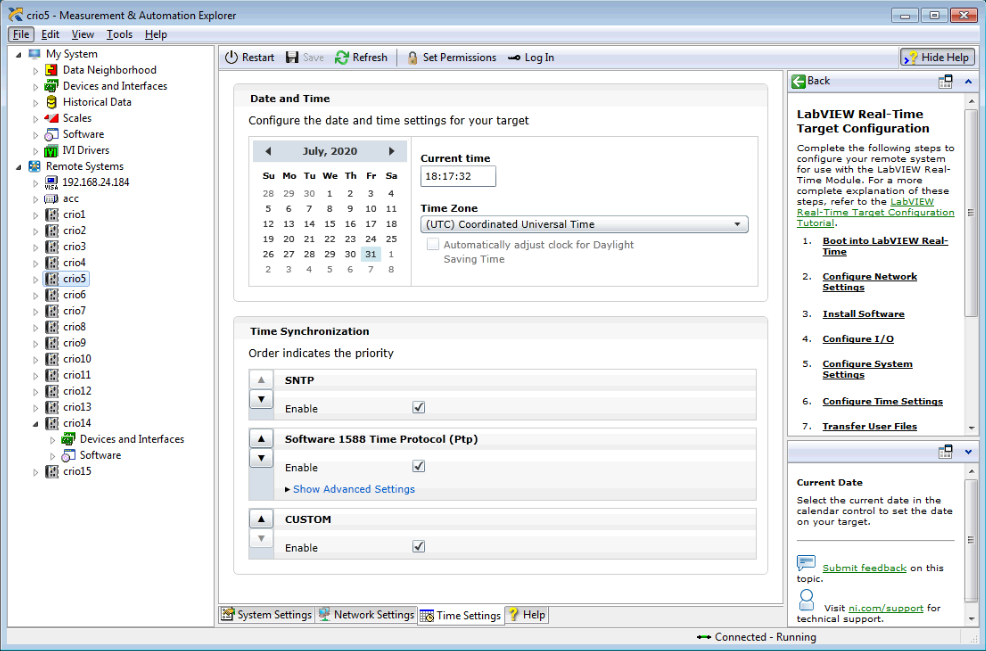
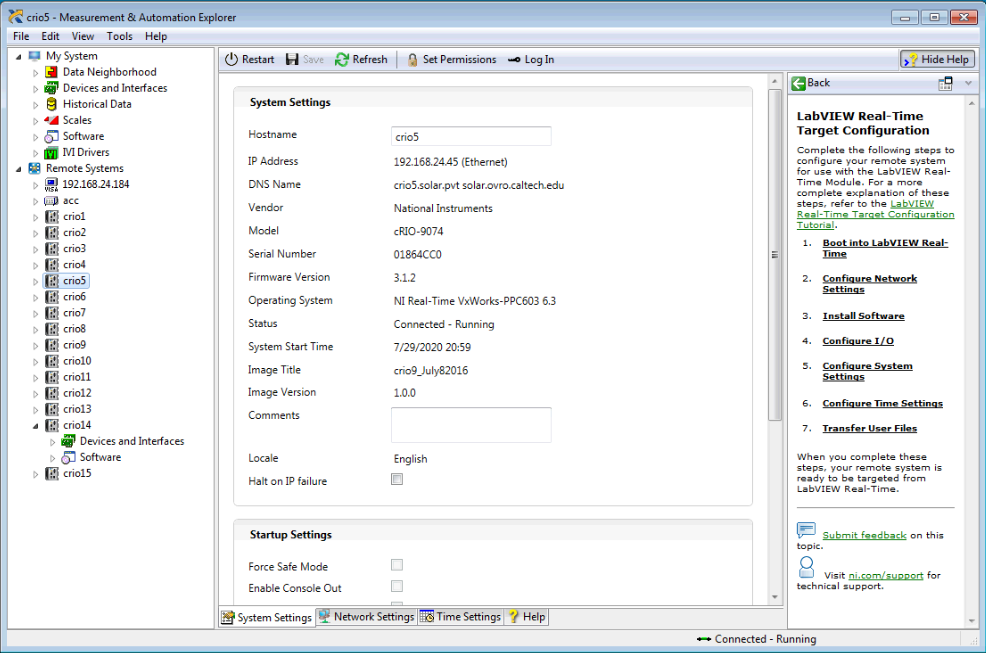
Goto Remote Systems and then select the CRIO that is not communicating.
Click the System Settings tab at the bottom of the window. Status should be listed as Connected - Running
Click on Refresh to reconnect.
The CRIO will have an IP address in the range of 192.168.24.41 to 192.168.24.53. If it is not working this IP address will be strange. Click Restart.
From the Schedule on Helios issue the command
sync ant#
where # is the antenna number.
If the communications are still not restored, you will need open Labview.
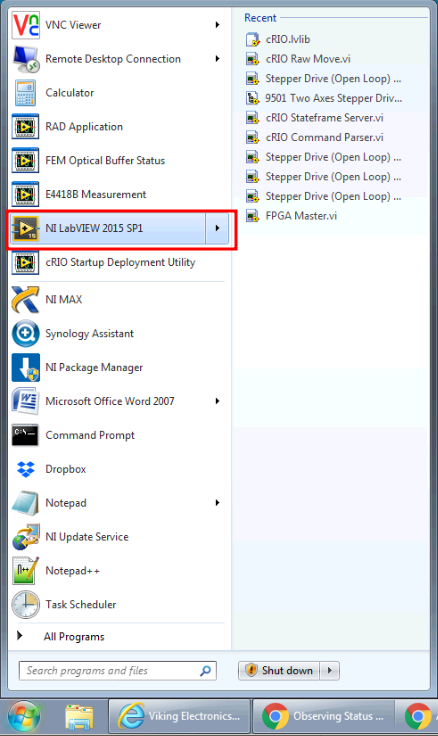
If it is not already open, Click Start then NI Labview 2015.
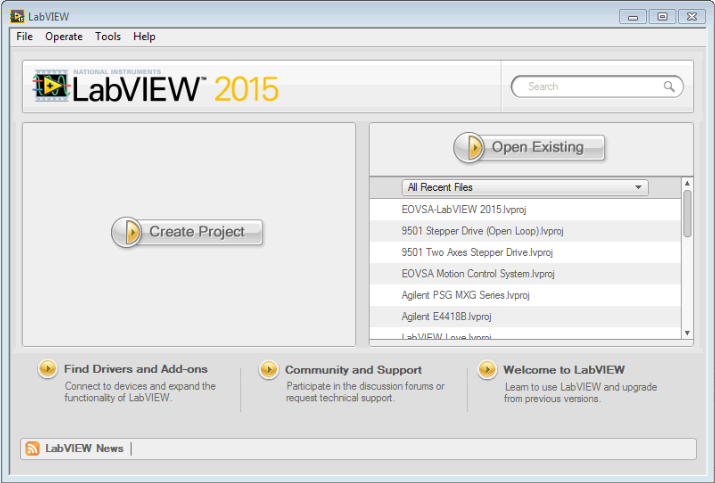
The LabView start screen will appear after a few seconds.
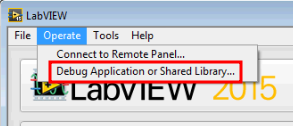
Click on the Operate menu option and then select Debug Application or Shared Library.
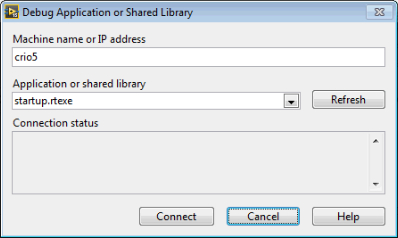
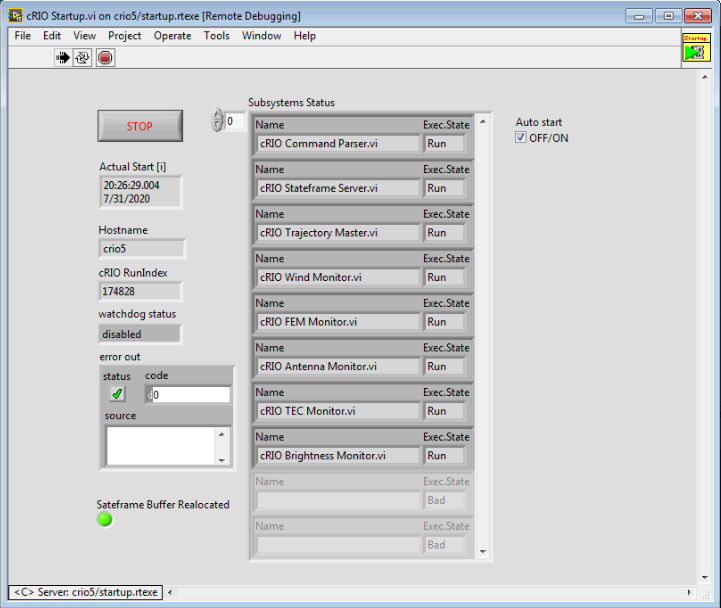
Once the new window opens type in the name of the CRIO in the Machine Name or IP Address box. Then click Refresh. The file startup.rtexe should appear. Click on Connect.
In the new window that opens check that the time is updating and that the time is correct an updating and that the Run index is updating. The Exec States should all be set to Run.
At the top of the screen click on the Stop Icon and then the Go icon (the arrow).
From the Schedule on Helios issue the command
sync ant#
where # is the antenna number.
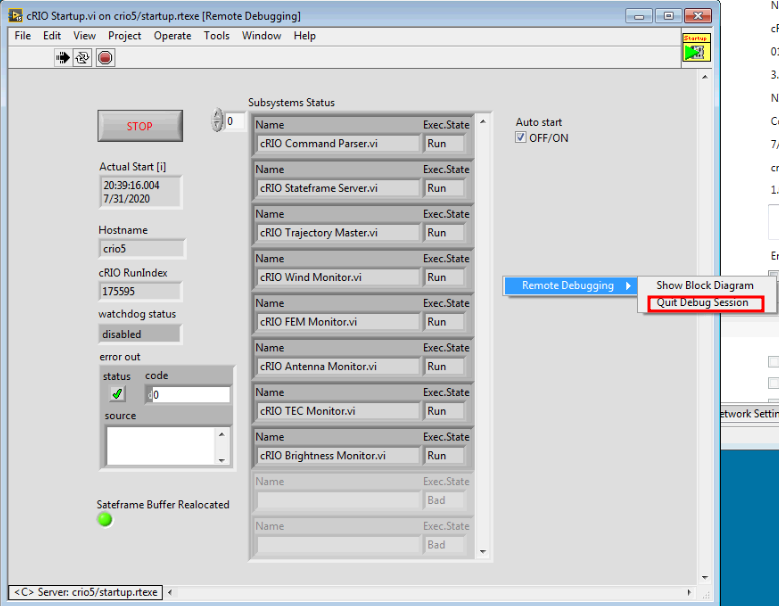
To exit from the Debug session, right click on an empty part of the form which will bring up Remote Debugging. Select Quit Debug Session.
Once again try sync ant#
If this does not work try sync-motion ant#
If the Labview is unable to start the debug session, it is possible that the power to the CRIO will need to be recycled. To do this goto the webpage
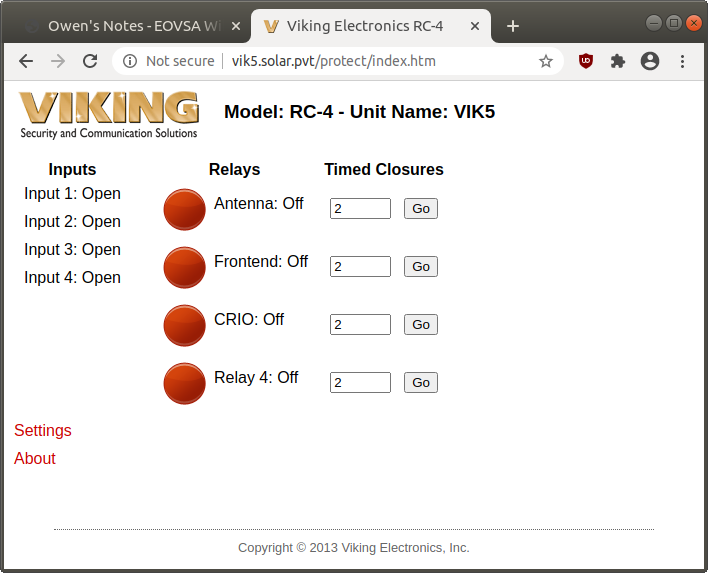
where # is the antenna number. Enter the username and password. The following screen should appear:
Note that when the relays are off, power is being supplied to the indicated system. In the image above, all relays are off so each system is powered.
To cycle the power to the CRIO, click on the circle next to CRIO. If the circle was red initially, it will go green, and vice-versa. Ensure that the relay is Off (red) before logging out.
Recycling Power to Antenna A
To recycle power to Antenna A goto http://pduanta.solar.pvt and enter the username and password.
There will be eight devices that can be chosen from. Click Cycle to recycle the power to the appropriate option.
Recovering Antenna A from a Power Outage
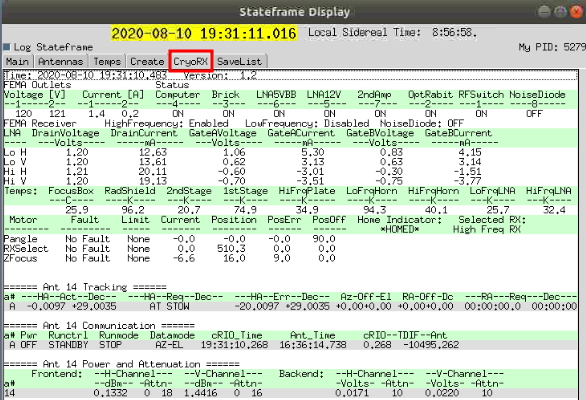
On the Stateframe display click on the CryoRX tab. This will bring up the display shown below.
Recycling Power to the FEM
Login to the feanta machine as follows:
ssh antctl@feanta
If the FEM Outlets on the CryoRX window are marked as Off then from a Helios terminal:
ssh antctl@feanta
Then type in the command:
/home/antctl/starburst/femTools/src/starburstControl start
Otherwise recycle the power to the FEM as follows:
/home/antctl/starburst/femTools/src/starburstControl stop
Wait about 10 seconds and the issue the start command:
/home/antctl/starburst/femTools/src/starburstControl start
Once done type in
exit
Recycling Power to the Brick
If faults are showing on the Motor section (4th green line down) the Brick power will need to be recycled. To do this issue the following commands from the Schedule Window:
outlet 3 off ant14
outlet 3 on ant14
Restarting the LNAs
From a Helios terminal:
ssh root@lna14.solar.pvt
Then issue the command:
./killAll python
Then press the up arrow until the most recent python command is found and press enter. Text will scroll up continuously
Just type exit even with the text scrolling to exit the ssh session.
From Schedule issue the command:
$lna-init ant14
The Drain Voltage for Hi H will be incorrect (~.61 when it should be 1.2). To correct this, from Schedule issue:
lna drain hh 2.4 ant14
Aligning the Receivers
The receivers must be properly aligned. From Schedule send the command:
frm-home ant14
It will take a few minutes for the FRM to find its home position. Once it has send the command:
frm-set-pa 0 ant14
to zero the positions.
Set the Hi Receiver:
rx-select hi ant14
Ant A Maths Error
Goto the webpage
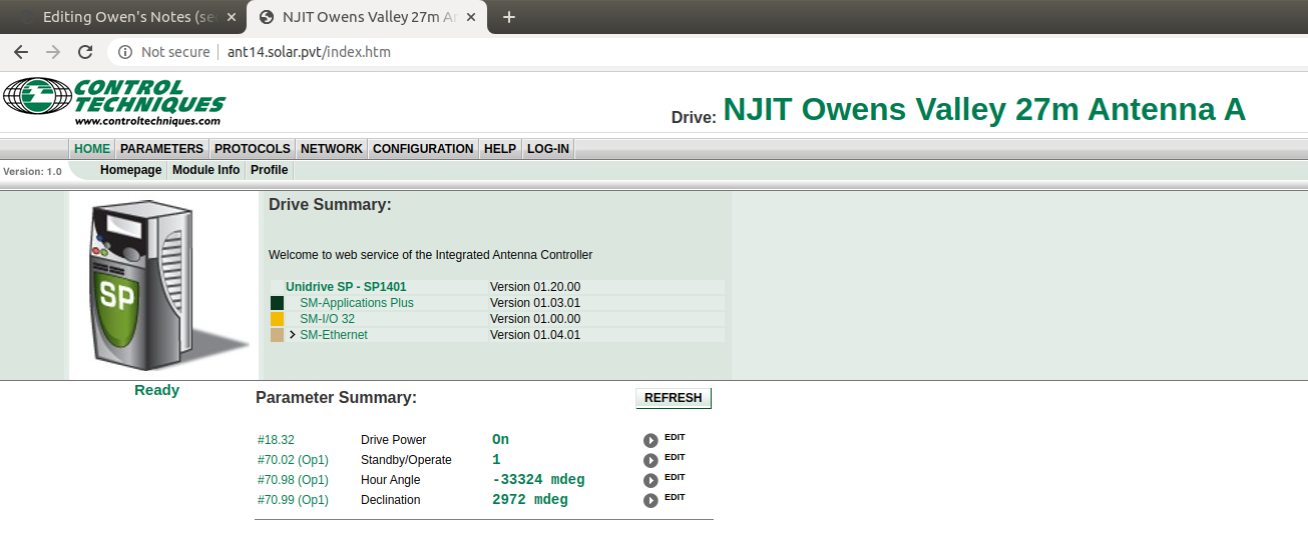
style="font-family:courier">https://ant14.solar.pvt. You should get to the screen as shown below:Ensure that on the left under the SP image that there is a green 'Ready' message.
If there is a Maths Error then follow the following procedure.
Click on the Login tab and enter the username and password.
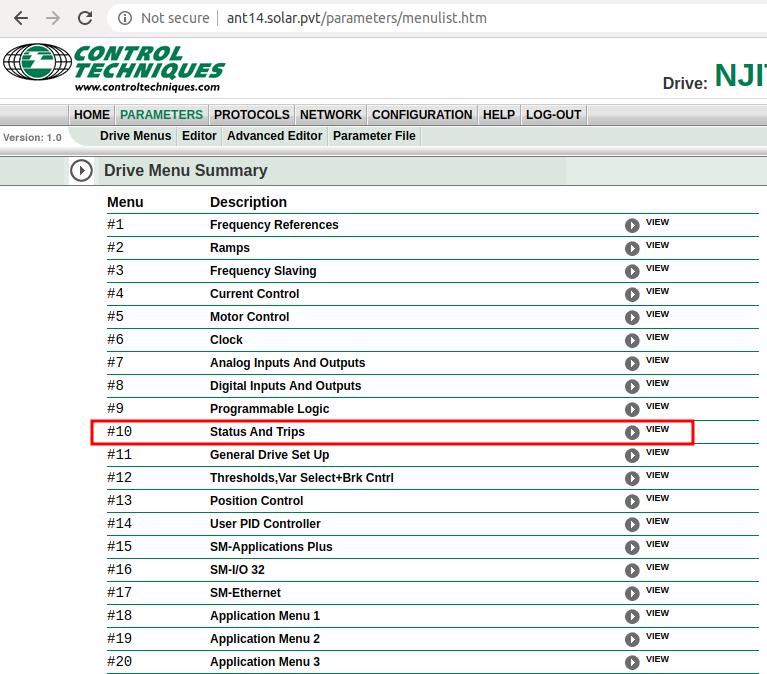
Click on the Parameter tab to see the following screen:
Click on view next to #10.
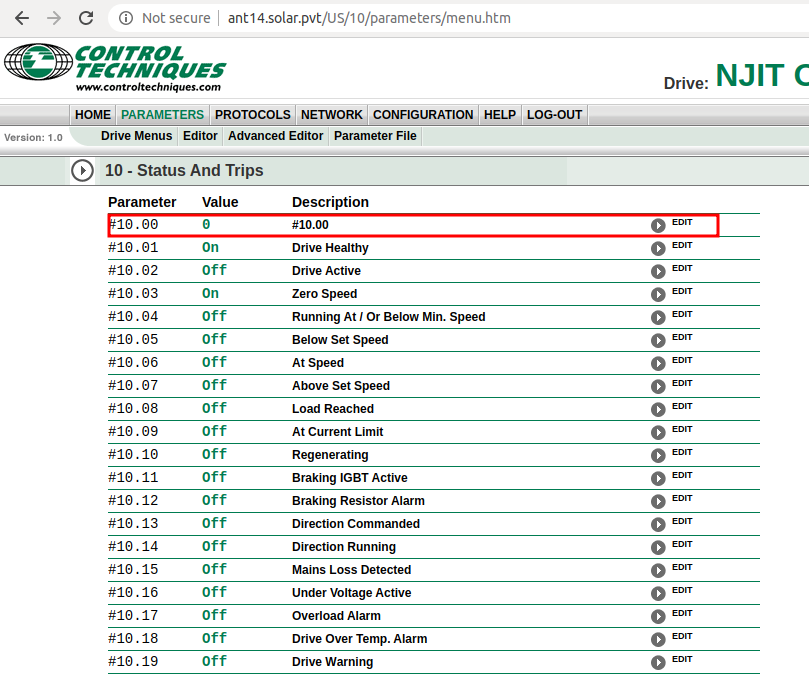
At the next screen click on view next to Item #10.00:
In the Update Value box enter 1070 and click on Change
Click on the arrow near the top of the page to return to menu 10.
Click on View next to Item #10.38
In the Update Value box enter 100 and click on Change
Computer Restart
Helios
To restart Helios, at a terminal enter the command
sudo reboot now
and wait about 5 minutes for it to restart.
Open a terminal and start the dropbox server:
python /home/sched/Downloads/dropbox.py start
Check to see if the time service is running. Enter the command:
chronyc sourcestats
If nothing is displayed, then the time service will need to be started by typing:
sudo systemctl restart chrony.service
Start the x11vnc server by typing:
x11go
Start the schedule by issuing the following commands:
cd ~/Dropbox/PythonCode/Current
screen
python /common/python/current/schedule.py &
Press <CRTL>AD to exit from screen.
Start the Stateframe display as follows:
screen
python /common/python/current/sf_display.py &
Press <CRTL>AD to exit from screen.
Open up a new terminal tab and log into the DPP by typing:
ssh user@dpp
Now issue the command:
ls /data1/IDB | tail 10
Open up a new terminal tab and log into the DPP as above. View the SMP_AFFINITY.sh by typing the command:
cat /home/user/test_svn/shell_scripts/SMP_AFFINITY.sh
Note down the two CPU's that are in use. Issue the following commands:
ipython --pylab
import dpp_plot_packets as dpp
dpp.fixpackets(cpu = [cpu1, cpu2])
where cpu1 and cpu2 are the CPUs that were noted down earlier.
Receiver Trouble Shooting and Repair
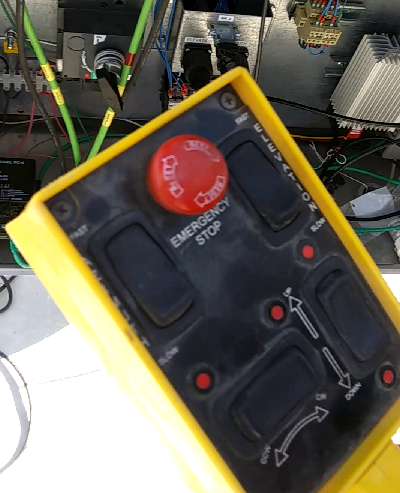
Connecting the Hand Controller
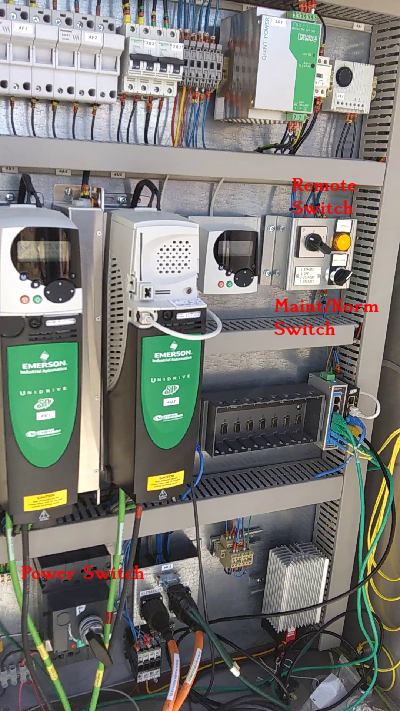
Power off the antenna by turning the power switch at the bottom right of the Antenna Control Box. Switch the Maint/Norm Switch to Maint. Switch the Remote Switch to Remote.
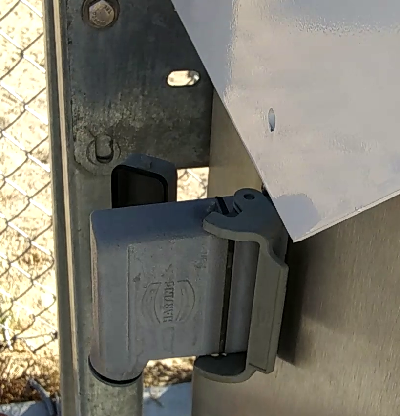
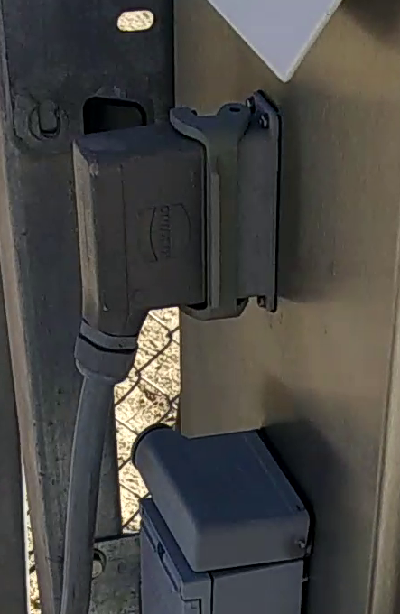
Remove the block from the hand controller port. Remember to place the block back after you have finished working on the antenna. It will not run in remote without it!
Connect the hand controller to the port.
Turn the power switch back on. Position the antenna to a position where it can be worked on using the azimuth and elevation controls on the hand controller.
Removing the Receiver
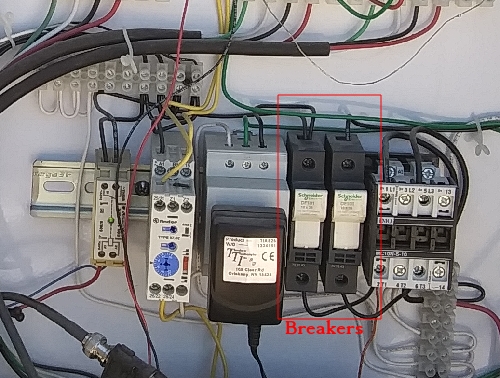
Switch off the power to the receiver at the auxiliary box by pulling down the two breakers.
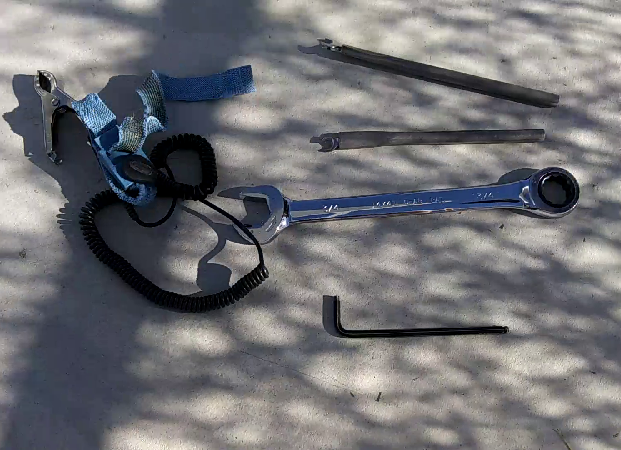
Below is an image of the tools required for removing the receiver.
Whenever touching the receiver ensure that the Anti-static strap is worn and grounded!
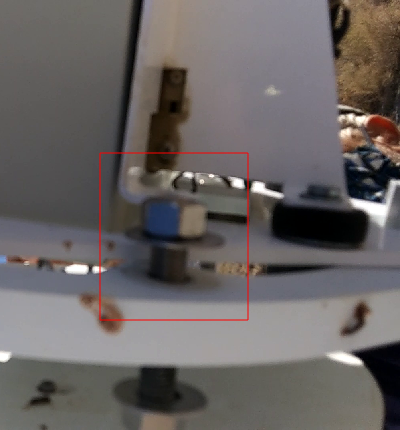
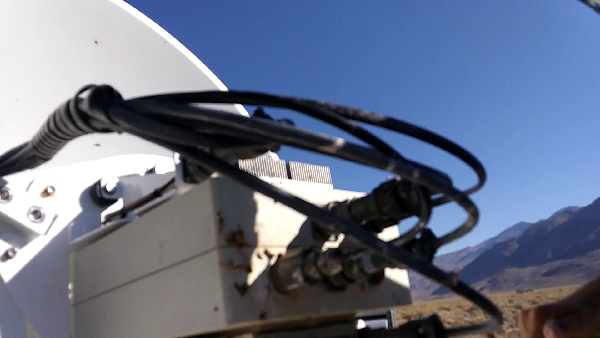
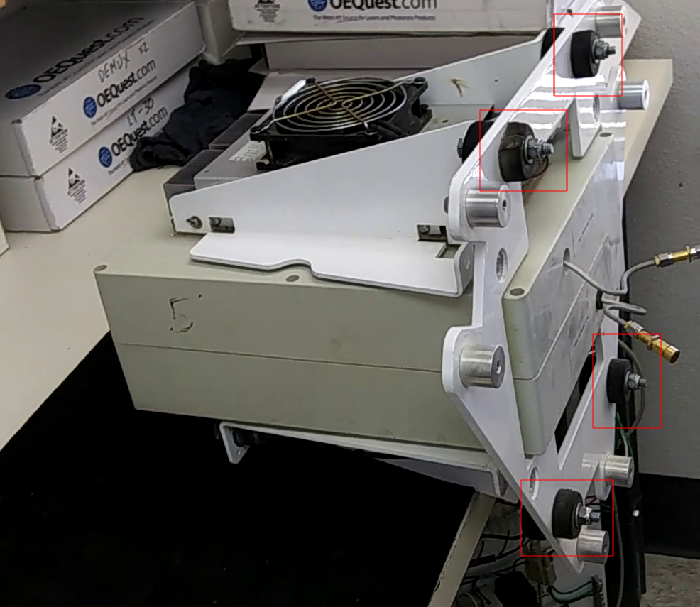
Loosen the nuts on bolts that attach the receiver to the feed almost the entire way but leave them on the bolts. The feed can be pressed forward to give enough room to detach the SMA cables.
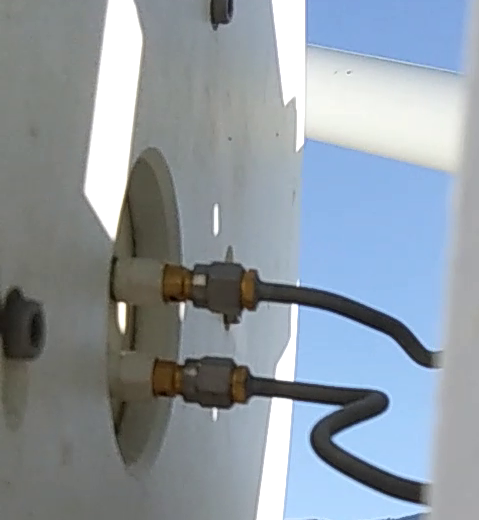
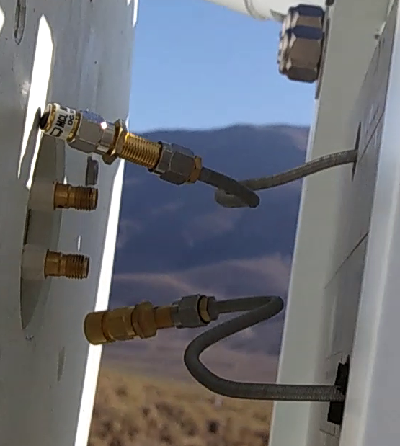
Carefully disconnect the SMA cables from the feed. Note the position of the horizontal and vertical polarisation cables.
Place caps on the end of the SMA cables.
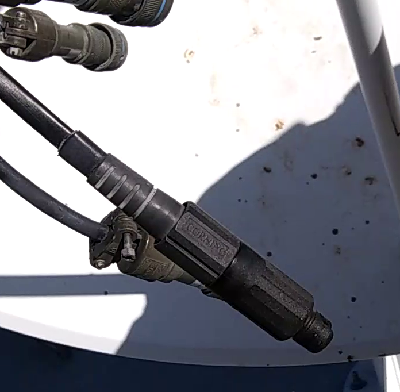
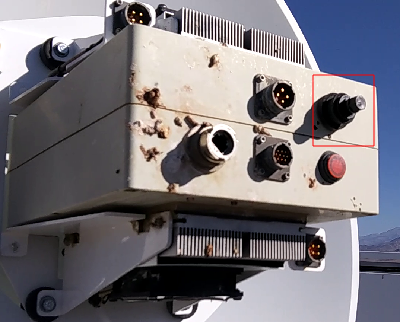
Carefully remove all of the cables from the back of the receiver.
Place a cap on the fibre optic port and the fibre optic cable.
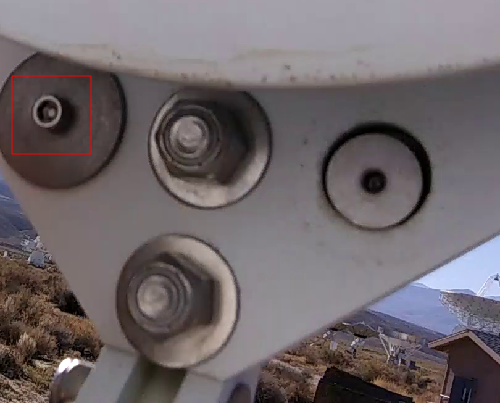
Remove the nuts entirely. Remove the 3 allen bolts.
The receiver can now be taken into the lab for testing or repair.
Opening the Receiver
Ensure you are grounded with the anti-static strap!
Remove removing the bolts from the stoppers, but keep the stoppers in place. Once removed the triangular front mounting bracket will slide off.
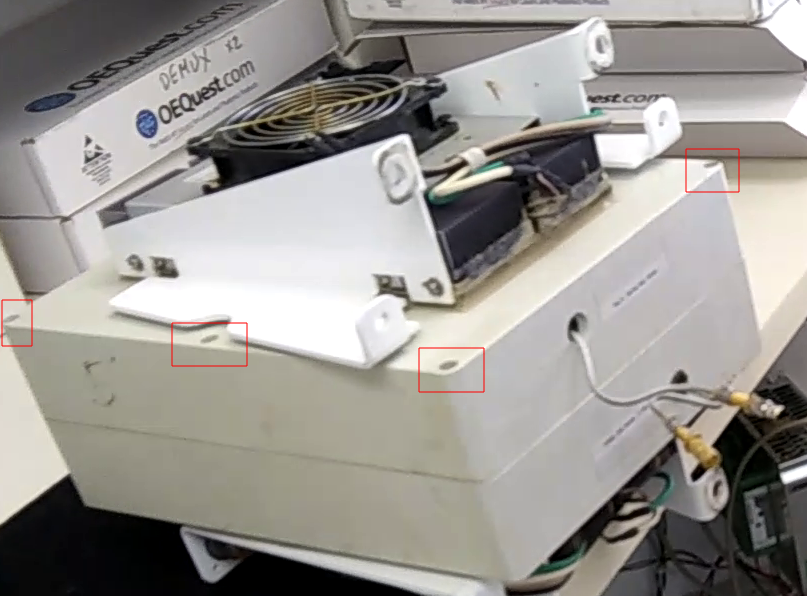
Recessed into the case are 6 screws that need to be undone. the location of 4 of these are shown in the image below. Loosen the screws using a Phillips head screwdriver. The will no come all the way out.
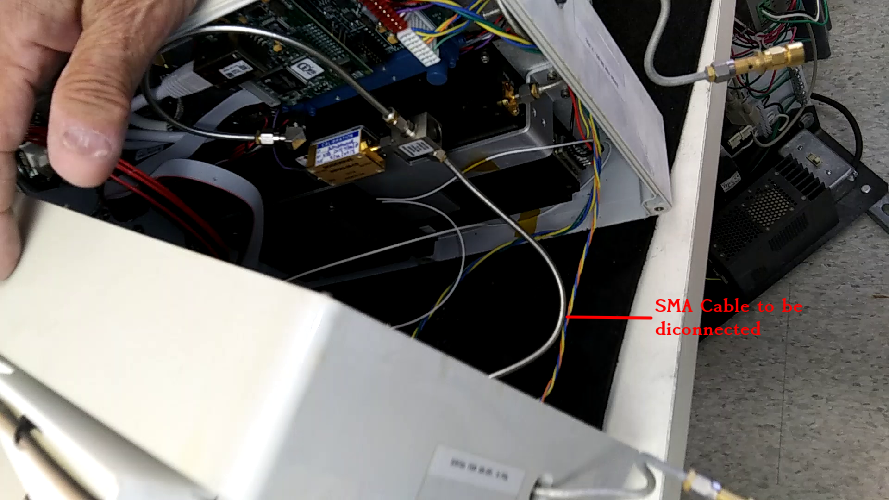
Place the receiver on it side and cautiously partially open the case. The SMA cable connecting the two halves together needs to be disconnected before the case can be fully opened. Carefully loosen the SMA cable on the Horizontal polarisation side and disconnect the cable.
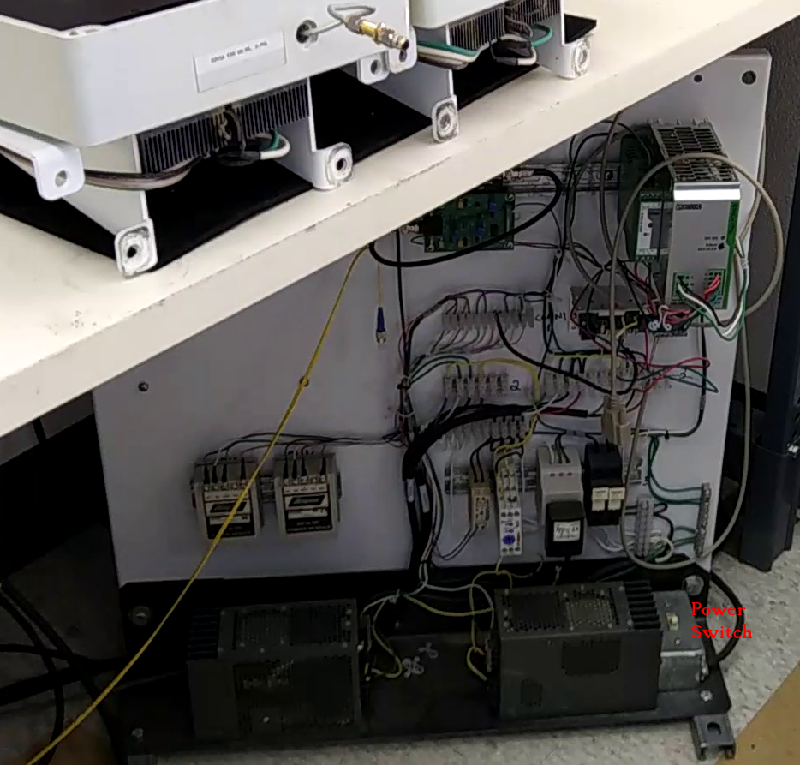
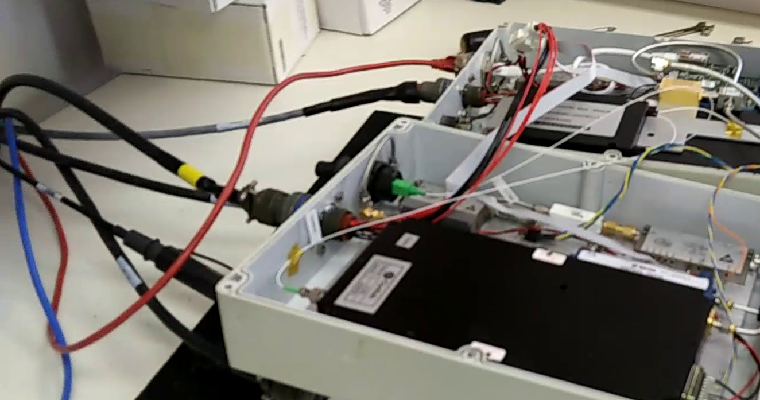
Cautiously fully open the case. There is a full replica of the Auxiliary box under the bench. If testing is to be performed then this will need to be connected. Note that the CRIO out at the antenna will also need to be powered on. Ensuring that the power is off, connect the cables to the receiver.
Whenever disconnecting or connecting components to the receiver, ensure that the power is off!
Reconnect the SMA cable between the two halves of the receivers.
Connecting the Power Meter
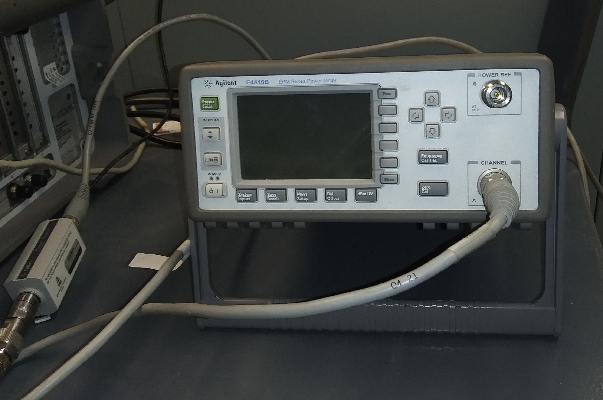
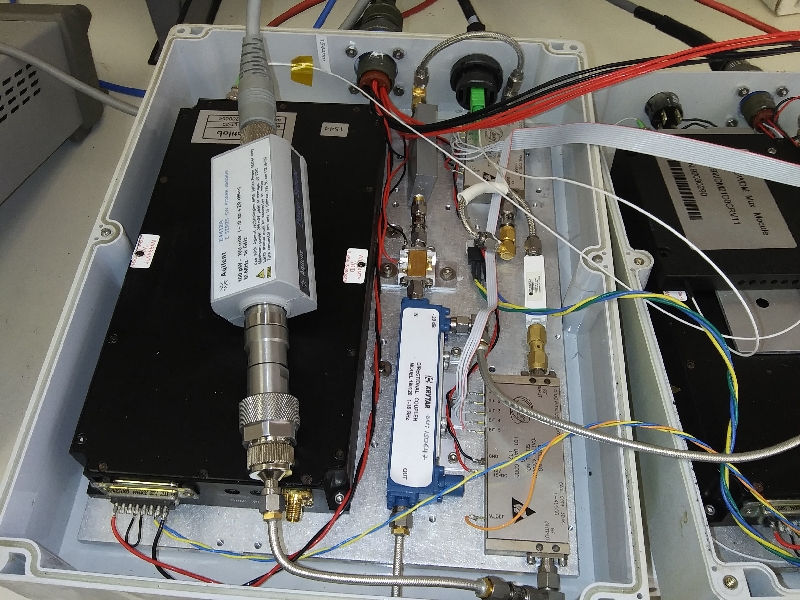
If required for testing, the power meter will need to be connected to the either the horizontal or vertical polarisation. The power meter is normally kept in the correlator room.
Connect the power meter to the appropriate polarisation as shown below.
Replacing the LNA
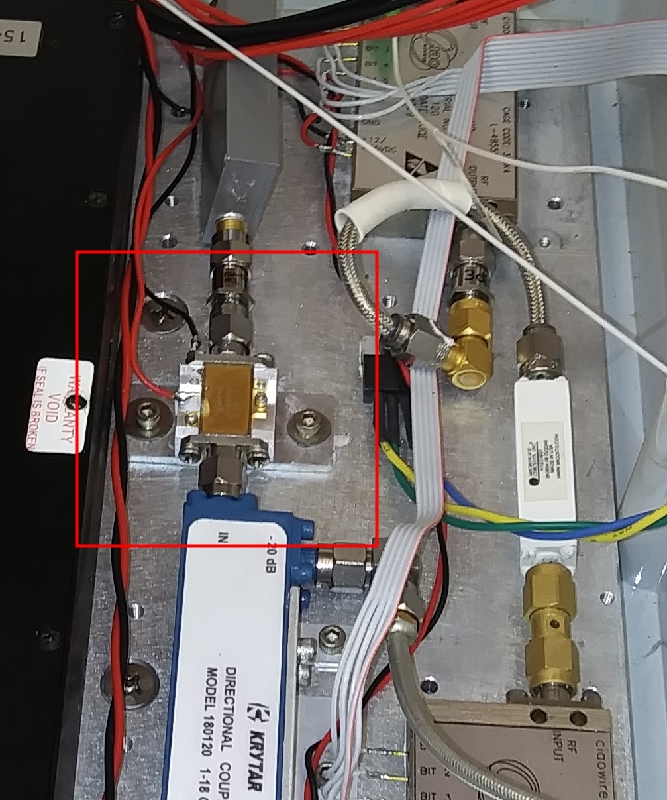
Ensure that power is off to the receiver. The LNA locations is shown below. It is in the same place on the other half of the receiver for the other polarisation.
Carefully unsolder the black and red wires connected to the LNA.
Undo the nuts on either side of the LNA. To undo they will move towards the LNA.
Remove the allen bolts fixing the LNA to the case.
Carefully remove the LNA.
Add some silicone heat sink compound to the base of the new LNA.
Repeat the process in reverse to install the new LNA.
Other Issues
Temperature Controller (30 Apr 2020)
Occassionally a front end temperature will show an error. This is usually because the temperature controller that reports the temperature has locked up. To fix this type the following command in the Schedule window:
tec$bc ant5
Replace ant5 with the antenna(s) that need the temperature controller rebooted.
To clear the temperature history (that updates every minute) issue the command:
tec$sc ant5
Packet Loss on DPP
If the packet monitoring program on the DPP computer shows lines similar to:
2020-05-28 15:43:42.001 0.0 0.0
then data packets are being lost. To fix this problem follow the following steps:
- Terminate the fix_packets() program by pressing [CTRL] C.
- Type !nano </home/user/test_svn/shell_scripts/SMP_AFFINITY.sh>
- Comment out the current cpu's and uncomment the following ones.
- Restart the fix_packets() program.
- Exit nano and save the file.
Occasionally the glitch will occur after the above procedure has been performed. In this case the DPP will need to be rebooted. The procedure to do that is as follows:
- Terminate the fix_packets() program and exit ipython by typing exit
- Enter the command sudo reboot now and wait about 5 minutes.
- Log back into the DPP by typing ssh -X user@dpp
- Enter the command /home/user/test_svn/shell_scripts/AMP_AFFINITY.sh
- Enter the command rmlock. This will remove the lock file.
- Start ipython by typing ipython --pylab
- Restart the fix_packets() program.
Restarting the Schedule
If the schedule needs to be restarted then follow the steps below:
- Click Stop and then Clear.
- Click Today and then Go.
Pipeline Problems
If there is no data showing at http://www.ovsa.njit.edu/browser/ then something has gone wrong with the pipeline processing. Below is a image of what the webpage looks like when an error has occurred.
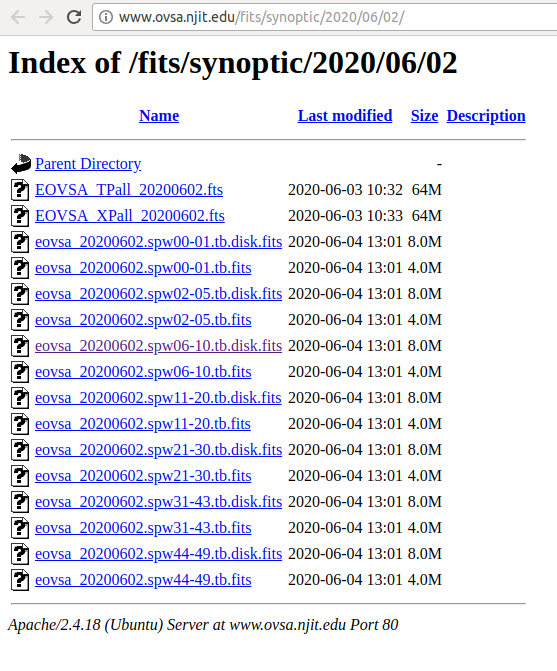
Clicking on the Newest button will refresh the page and upload the latest data. If this does not correct the problem take a note of the date in the web address of the page. Then click on 'Today's Data'. A list of fits files should appear as below:
The log files will need to be inspected in order to dermine what went wrong.
Note: I am in the process of updating scripts, so the diagnostic procedure is not complete - OG
Warning on Power and Attenuation
On the state frame display, occasionally an antenna will turn yellow (warning). This will usually be because the 1st attenuator value is not zero. This will occur during a gaincaltest or a burst. The value should be even. If the value is 9, then the CRIO file will most likely need to be be reloaded.
DO THIS WITH EXTREME CAUTION. BE ABSOLUTELY CERTAIN THAT RELOADING THE CRIO FILE NEEDS TO BE DONE.
- From helios, open a terminal and type cd /Dropbox/PythonCode/Current/crio_inis
- For the antenna that need to be reset, find the most recent '.ini' file. For example, for antenna 10 this may be 'crio10-2019-09-28.ini'. Make a note of this file.
- Enter the command ftp crio10.solar.pvt. Replace crio10 with the apropriate CRIO number.
- Enter the username and password when prompted.
- Enter the following commands:
- cd ni_rt/startup
- put crio10-2019-09-28.ini crio.ini
- bye
- replacing 'crio10-2019-09-28.ini' with the appropriate file for the CRIO that needs to be reset.
- The above commands have reloaded the crio.ini file. The CRIO now needs to be reset. For example, Antenna 10 will be reset by issuing the following commands from the schedule window:
- sync ant10
- tracktable sun_tab.radec ant10
- track
The gains and pointing may need to also be updated.
Schedule Commands not Working
If schedule commands are not working then the ACC may need to be restarted.
To determine if the ACC need restarting issue a command from Schedule. At the top right of the Stateframe the 'Task' should be updated. if it is not then follow the following procedure:
- Go to the Windows computer and from the Quicklaunch menu select 'EOVSA E&C'.
- Once running click on 'Reset ACC' and wait about 10 seconds.
Queue Overflow Error
On the Stateframe display, a 'Queue Overflow' Error may occur under the Frequency Tuning bar. To correct this issue type the following command into the Raw Command box on the schedule:
lo1a-reboot
Stop and then restart the schedule.
Antenna 12 Not Tracking
Antenna 12 will occasionally seem to stop tracking. This is usually because it has lost where it is pointing. It will move incredibly slowly until it reaches its limit before returning to regular tracking. This process cant take up to about 20 minutes. If it has not resolved it tracking problems in this time, proceed with normal trouble shooting.
Useful Tools and Utilities
Screen Command
On linux system, the screen command allows a program to be run in the background. This is particularly useful for processes that take a long time to complete. In addition it will display output when the screen is activated.
To start a screen session, open up a terminal and issue the command:
screen
Text will appear and you will be prompted to press space or return. Just press return.
Type in the command that you want to be performed. The process will then start. You can exit the screen by pressing<CRTL> A D
The command will still be running. To re-open the screen at any time simply type:
screen -r
