GSFITVIEW Help
GSFITVIEW Installation
GSFITWIEW is part of the GSFIT IDL Package
To get installation instructions for the IDL GSFIT package, please visit the GSFIT Installation page.
Launching the GSFITVIEW GUI Application
The GSFITVIEW GUI application may be launched as follows
IDL> gsfitview [,gsfitmaps]
where the optional gsfitmaps argument is either the filename of an IDL *.sav file containg a GSFIT Parameter Map Cube structure produced by the GSFIT or GSFITCP applications, or an already restored such structure.


The GSFITVIEW GUI is organized as follows:
- Menu Toolbar
- Data Map Display Panel and related options controls
- Fit Parameter Map Display Panel and related options controls
- Spectral Fit Plot Panel and related options controls
- Parameter Lightcurve Plot Panel and related options controls
- Parameter Histogram Plot Panel and related options controls
- Selected Fit Parameter Listing Panel
GSFITVIEW Menu Toolbar
The GSFITVIEW Menu Toolbar contain the following actionable elements:
 Upload GSFIT Parameter Map Cube
Use this button to restore an IDL *.sav containg a GSFIT Parameter Map Cube structure exported from GSFIT. To learn more about this type structure and how it may be restored outside the GSFITVIEW application for command line or programmatic manipulation, please visit GSFIT Data Format.
 Import Fit List
Use this button to restore a native GSFIT *.log file containing a list of pixel-based fit solutions saved in this format by GSFIT, or sequentially logged into by GSFITCP at runtime. To learn more about this type structure and how it may be restored outside the GSFITVIEW application for command line or programmatic manipulation, please visit GSFIT Data Format.
 Select Color Table
Use this button to select a color table for displaying the microwave maps and spectra. GSFITVIEW uses as default the IDL color table #39 (Rainbow+White)
 Upload Reference Maps
Use this button to upload one ore more reference SSW IDL maps from an IDL *.sav, to use them as background maps or overlaid contours in the Data or Fit Parameter maps plot panels.
 Select Mouse Mode
Use this set of mutual exclusive radio buttons to switch between four modes of mouse tool operation. Due to the fact that the two map display area are synchronized, any mouse actions performed on any of the map plot areas are automatically replicated on the other one.
- FOV/Pixel Selection Mode: Use this mouse mode to concomitantly zoom in and out the field of view (FOV) of the data and parameter maps, or to select the pixel coordinates for which the data spectrum and the GSFIT solution are displayed in the Spectral Fit panel.
- To zoom in, press, hold, move, and release the left mouse button to select the desired rectangular FOV (rubber-band selection process). To revert to the full FOV, use a single left-button click on any of the two map plots.
- Use a mouse right-click on any of the two map plots to make a pixel selection. The currently selected pixel is indicated by a set of horizontal and vertical dotted lines on both panels. Alternatively, the pixel may be selected using the Cursor X and Cursor Y numerical controls located below the data map plot area.
- Rectangular ROI Selection Mode: Use this mouse mode to define a rectangular region of interest (ROI) through a left button rubber-band selection process. The selected ROI is preserved and displayed as long it is not replaced by another ROI selection, or deleted by a single left button click.
- Polygonal ROI Selection Mode: Use this mouse mode to define the vertices of polygonal ROI through a series of sequential left button clicks. To finalize the process, use a right button click to define the last vertex, which will be automatically connected with the first one. The selected ROI is preserved and displayed as long it is not replaced by another ROI selection, or deleted by a single left button click.
- Free-hand ROI Selection Mode: Use this mouse mode to define an arbitrarily shaped ROI contour through a continues movement of the mouse cursor while the left button is pressed. To finalize the process, release the left button to define the last vertex of the countour, which will be automatically connected with the first one. The selected ROI is preserved and displayed as long it is not replaced by another ROI selection, or deleted by a single left button click.
 Set Contour ROI
Use this button to select as a ROI the user-defined contour overlaid on the data and parameter maps, if any.
 Save ROI
Use this button to save to an IDL file the current ROI selection as a set of two arrays, xroi and yroi, containing its vertex heliocentric coordinates.
Restore ROI
Use this button to import from an IDL file a set of xroi and yroi ROI vertex coordinates previously saved by GSFIT or GSFITVIEW, or generated by alternative means.
 Save Histogram Data
Use this button to save the currently displayed histogram data to an IDL *.sav file.
 Plot Histogram to Postscript File
Use this button to plot the currently displayed parameter histogram to a PostScript file.
GSFTIVIEW uses a pair of panels to display in a synchronized manner the data and parameter maps selected by the user. The user is also provided with a series of input fields that control the appearance of these plots.
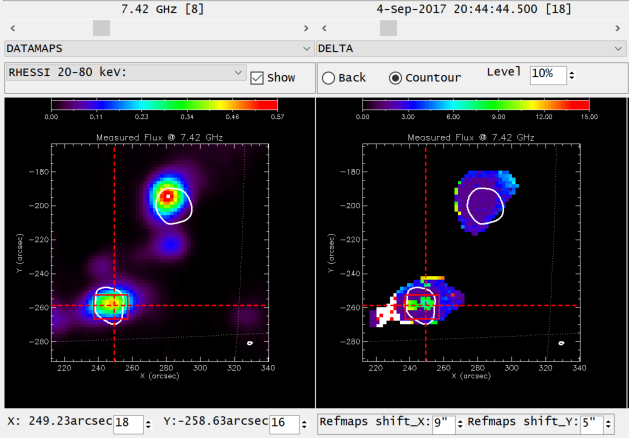
GSFITVIEW Map Display Panels: Left Panel: EOVSA 7.42 GHz 4-Sep-2017 20-44:44.500 UT. Right Panel: GSFIT DELTA parameter map. On both panels, the white-solid RHESSI 20-80 keV 10% contours are shown shifted relative to their original position by the user-defined xshift and yshift input parameters displayed at the bottom of the right panel. The coordinates of the particular pixel selection marked by the pair of horizontal and vertical dotted lines are displayed in the Cursor X and Cursor Y fields located below the left panel, the values of which may be controlled either by direct keyboard input, or by right-button mouse click when in the Cursor Mode. A user-defined ROI box is also shown by the red solid rectangles overlaid on both plots.

Data Map Display Panel
In this left-side panel, the user may choose to display one of the [[math]\displaystyle{ nfreq\times ntimes }[/math]] maps generated by GSFIT (see GSFIT Data Format for a description of the GSFIT input and output map data formats):
- DATAMAPS, which represent the GSFIT input microwave maps from which the parameter maps were derived
- ERRMAPS, which represent the errors used by GSFIT to weight the spectral fits (see GSFIT_Help for a detailed description of how these errors are estimated).
- FITMAPS, which represent the pixel-based GSFIT spectral-shape solutions.
The selection of the map displayed in this panel may be made via the drop list menu and the frequency and time selection scrollbars.
Parameter Map Display Panel
Reference Maps Options
In addition, the user may choose, via a dedicated drop list menu, to display a contextual reference map, in both left and right panels. The selected reference map may be displayed either as a background map, or as a one-level contour, as chosen through the combination of options provided by the Show checkmark, Background/Contour radio buttons, and Level percentage . By default, the list of available choices contains two options, namely Reference: Data and Reference: Parameter, which allow the use as reference maps of one of the currently maps displayed in either the left or right panel. In addition, the user may use the ![]() toolbar button to uploa and add to the reference list any number of contextual maps produced by other instruments.
toolbar button to uploa and add to the reference list any number of contextual maps produced by other instruments.

GSFITVIEW uses this panel to display statistical information about the selected fit parameters, either as a 2D dynamic histogram image that packs on the horizontal axes the 1D parameter distributions corresponding to each individual time frame, or as a 1D histogram in which all time frames are combined, if the 1D checkmark is set. The default minimum and maximum parameter values used to build these histograms, as well as the number of bins, may be controlled through the input fields located below the histogram plot area. GSFIT uses as default histogram range the full parameter range, however, if a diffrent range set by the user, it is stored in memory for the duration of the GSFITVIEW session and used as default value every time the same parameter is selected for display.
In addition, the following options may be selected through additional checkmarks:
- OutROI: If this option is unchecked (default), GSFITVIEW builds the histograms using only the pixels located inside the current ROI contour (if any defined). If this option is checked, only the pixels outside the ROI contour are used If no ROI contour is defined, all parameter map pixels are used, regardless this checkmark selection.
- LogBins: use this checkmark to use logarithmic histogram bins instead of the default linear bins
- LogHist: use this checkmark to display the 1D histograms using logarithmic vertical scale.
- Over2D, to overpot the fit parameter lightcurve and its associated 1-sigma uncertainties on top of the 2D histogram plot.

a:DELTA fit parameter 2D dynamic histogram corresponding to the selected ROI pixels. The time evolution of the DELATA values corresponding to the selected pixel are overlaid as white symbols and error bars.
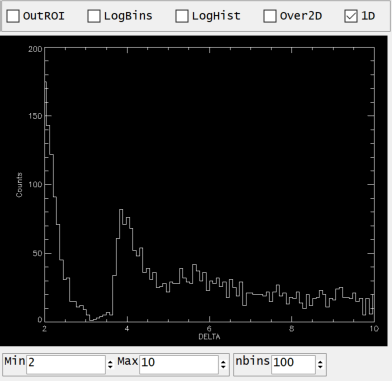
b:DELTA fit parameter 1D histogram (all time frames included) corresponding to the selected ROI pixels.
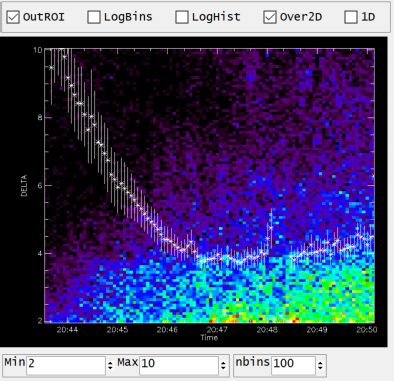
c:DELTA fit parameter 2D dynamic histogram corresponding to the pixels not included n the selected ROI area. The time evolution of the DELATA values corresponding to the selected pixel are overlaid as white symbols and error bars.
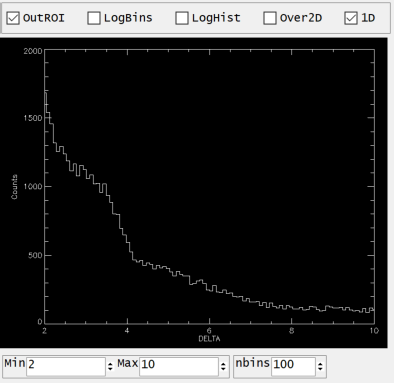
d:DELTA fit parameter 1D histogram (all time frames included) corresponding to the pixels not included in the selected ROI area.


Selected Fit Parameter Listing Panel
This panel lists all fit parameters and their associated 1-sigma uncertainties for the currently selected pixel in the map display panel. If any of the fit parameters were fixed by the GASFIT user, the associated uncertainties are set to zero.
